A grayscale diagram of a Venturi tube illustrating fluid velocity and pressure changes across its sections A, B, and C, with pressure gauges.
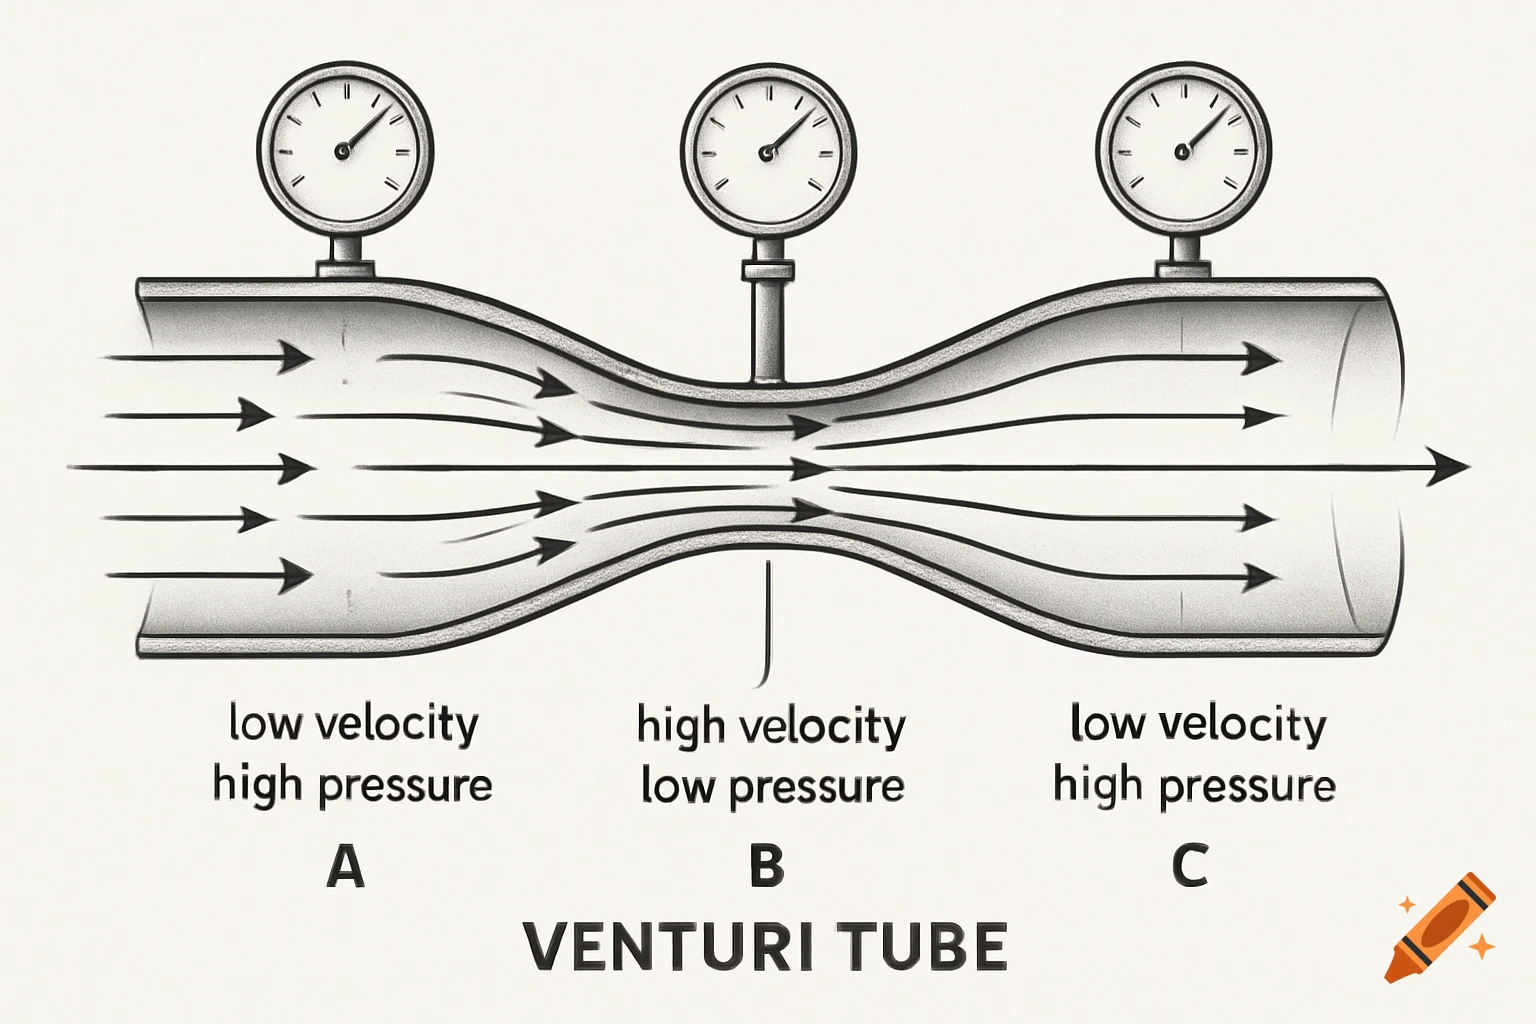
The diagram shows a Venturi tube divided into three sections: A (inlet) – B (throat) – C (outlet). Sections A and C have equal diameters, meaning the airflow entering and leaving has the same mass flow. The middle section B is narrower (the Venturi throat). As air passes through B, its velocity increases, while the static pressure decreases, according to Bernoulli’s Principle. In section A (wide): Velocity gauge → low Pressure gauge → high In section B (narrow): Velocity gauge → high Pressure gauge → low In section C (wide again): Velocity gauge → returns to low Pressure gauge → returns to high This demonstrates that when air speeds up, its static pressure drops, and vice versa — the total energy remains constant. See more