A watercolor-style pie chart infographic with a VAIO logo, detailing Creative Innovators, Early Adopters, and Heavy Users.
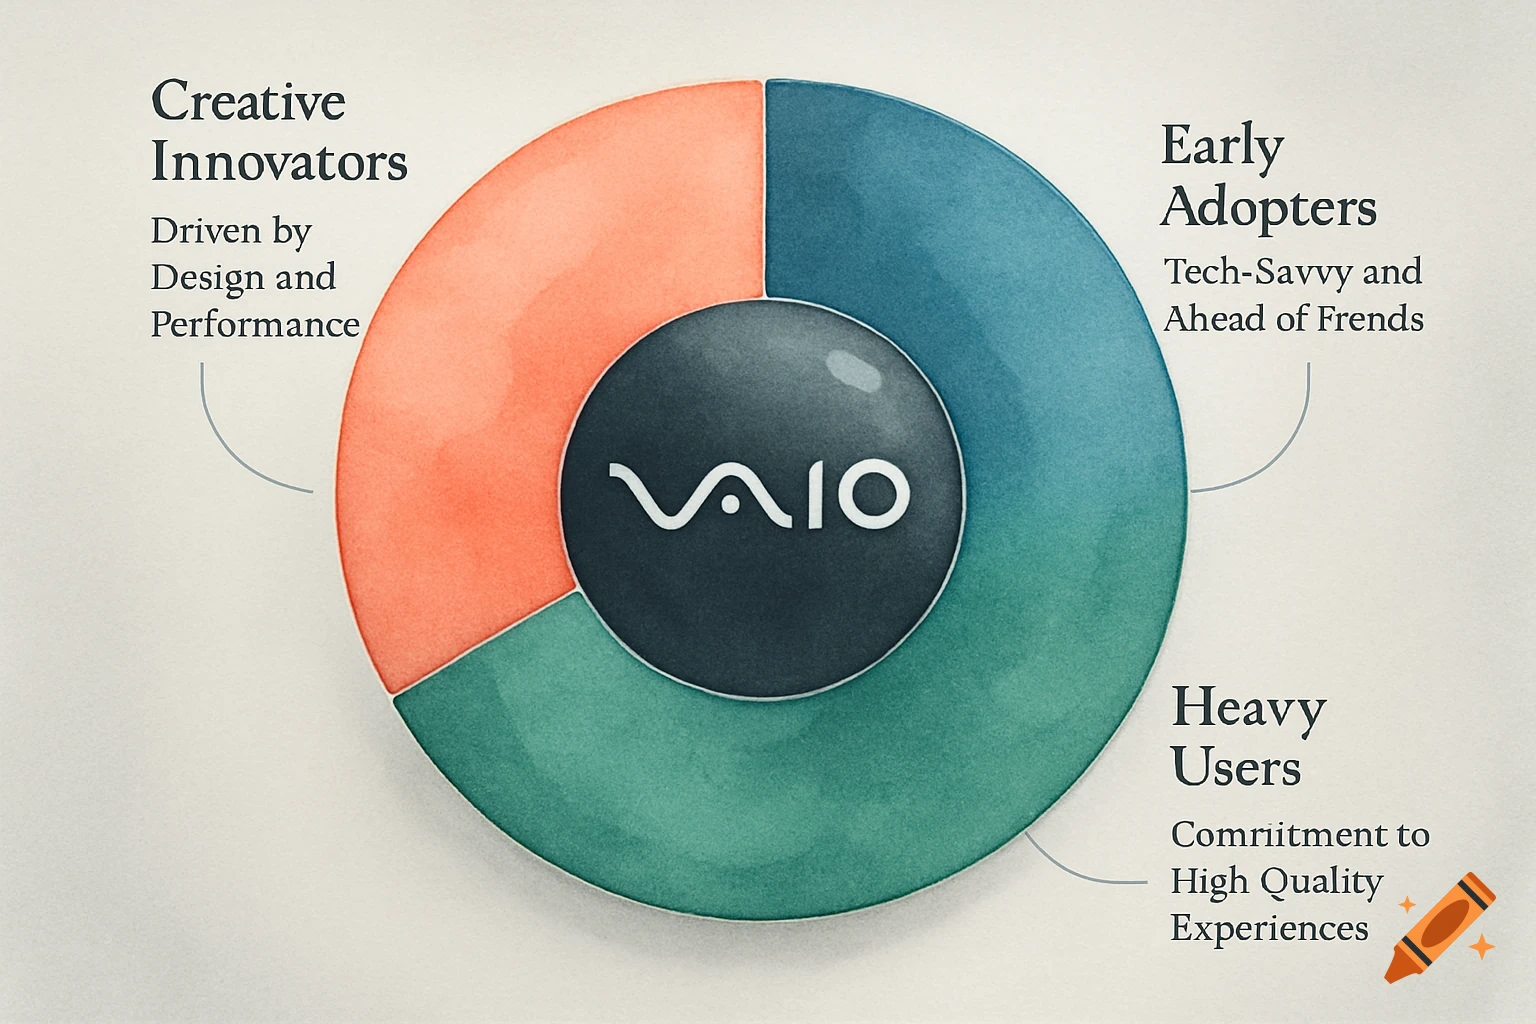
based on the VAIO project im doing and and this information: (Psychographics: Creative thinkers and early developers, value premium design and performance. Behavioral: Regular laptop users, online shoppers, brand-conscious, loyal to high-quality tech. Usage: Moderate to heavy usage for work, study, and entertainment.) make me a image Pie chart or infographic showing psychographic traits (Innovators, Early Adopters, Heavy Users). See more