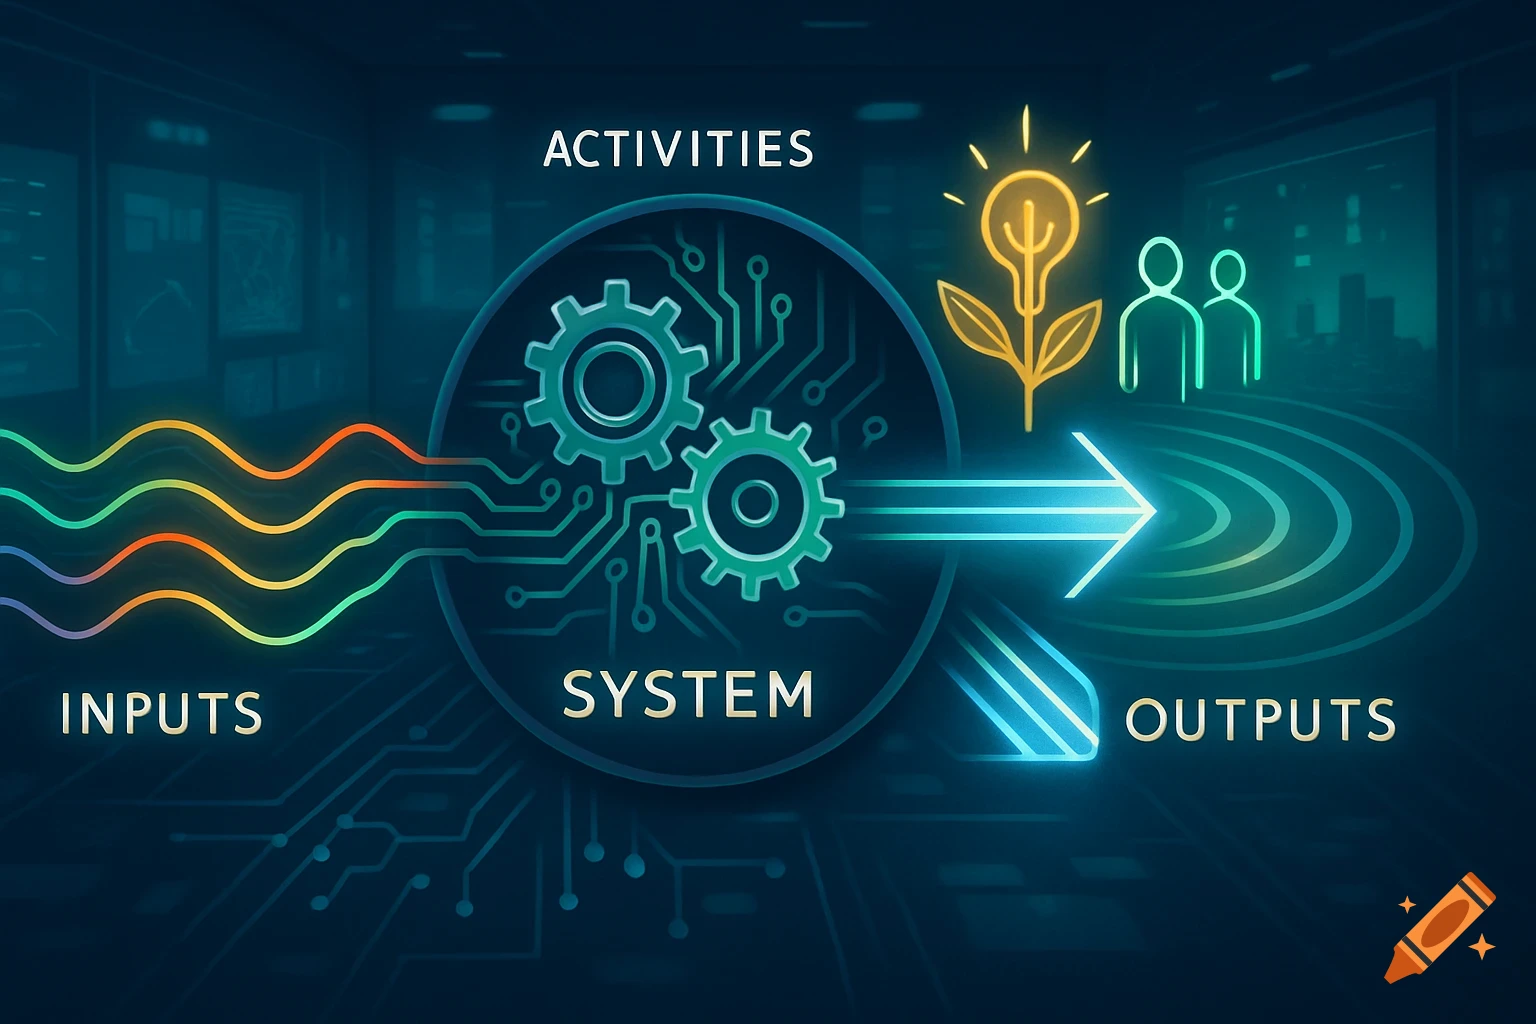
Illustration showing the journey from data to insights to automated outcomes, with icons and text labels.
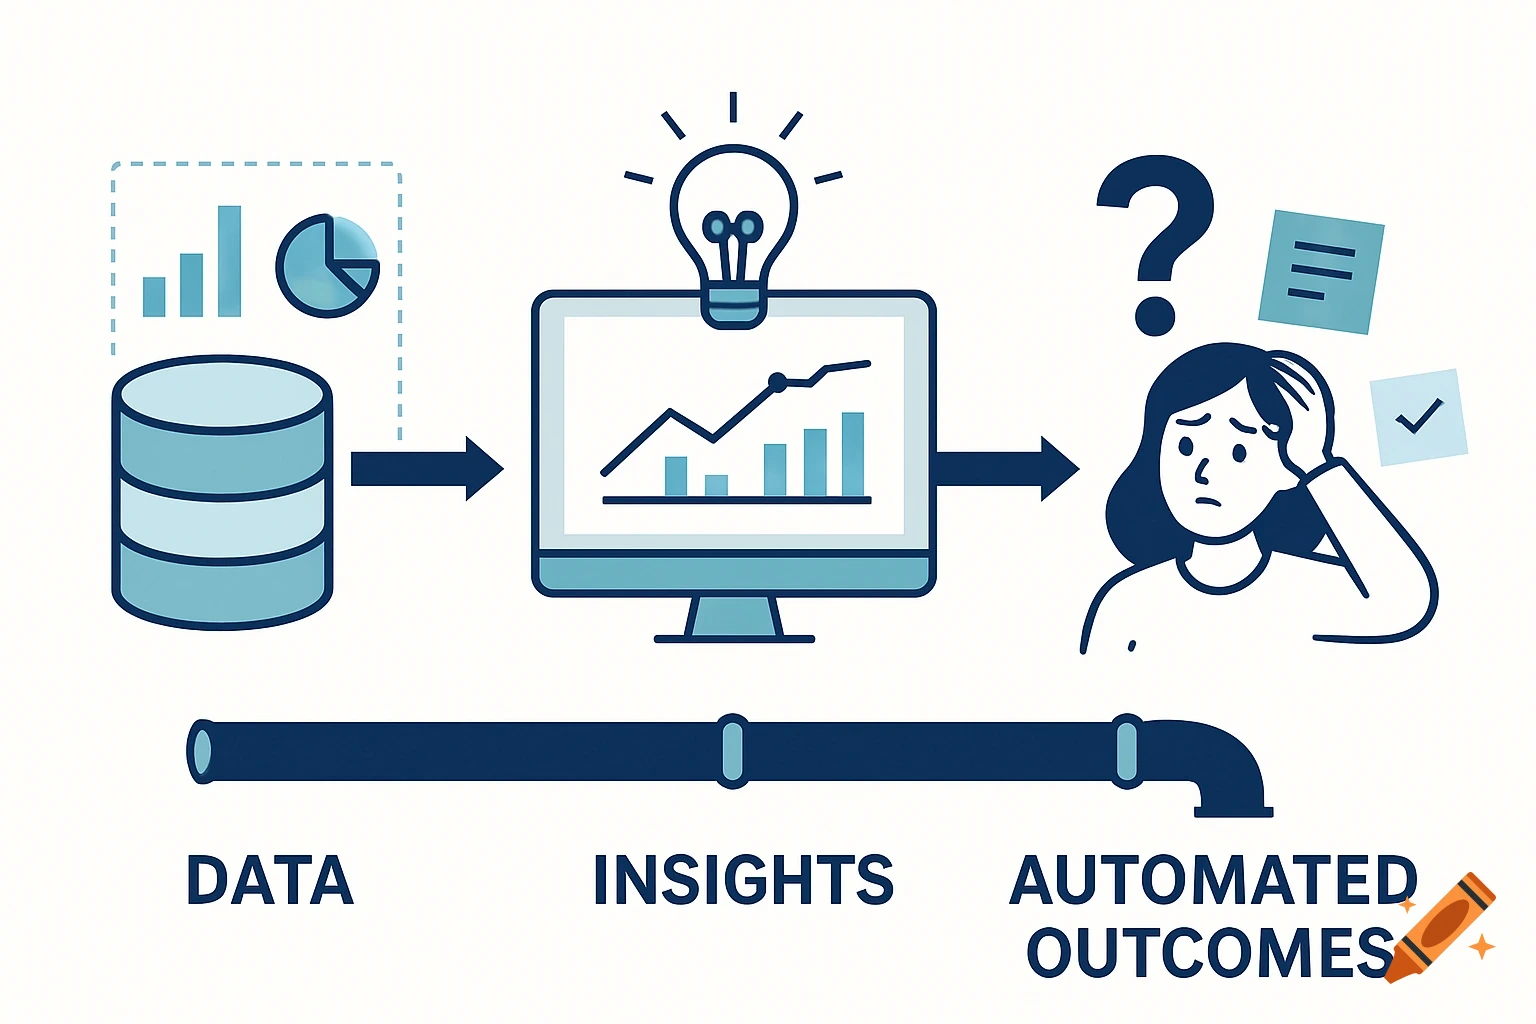
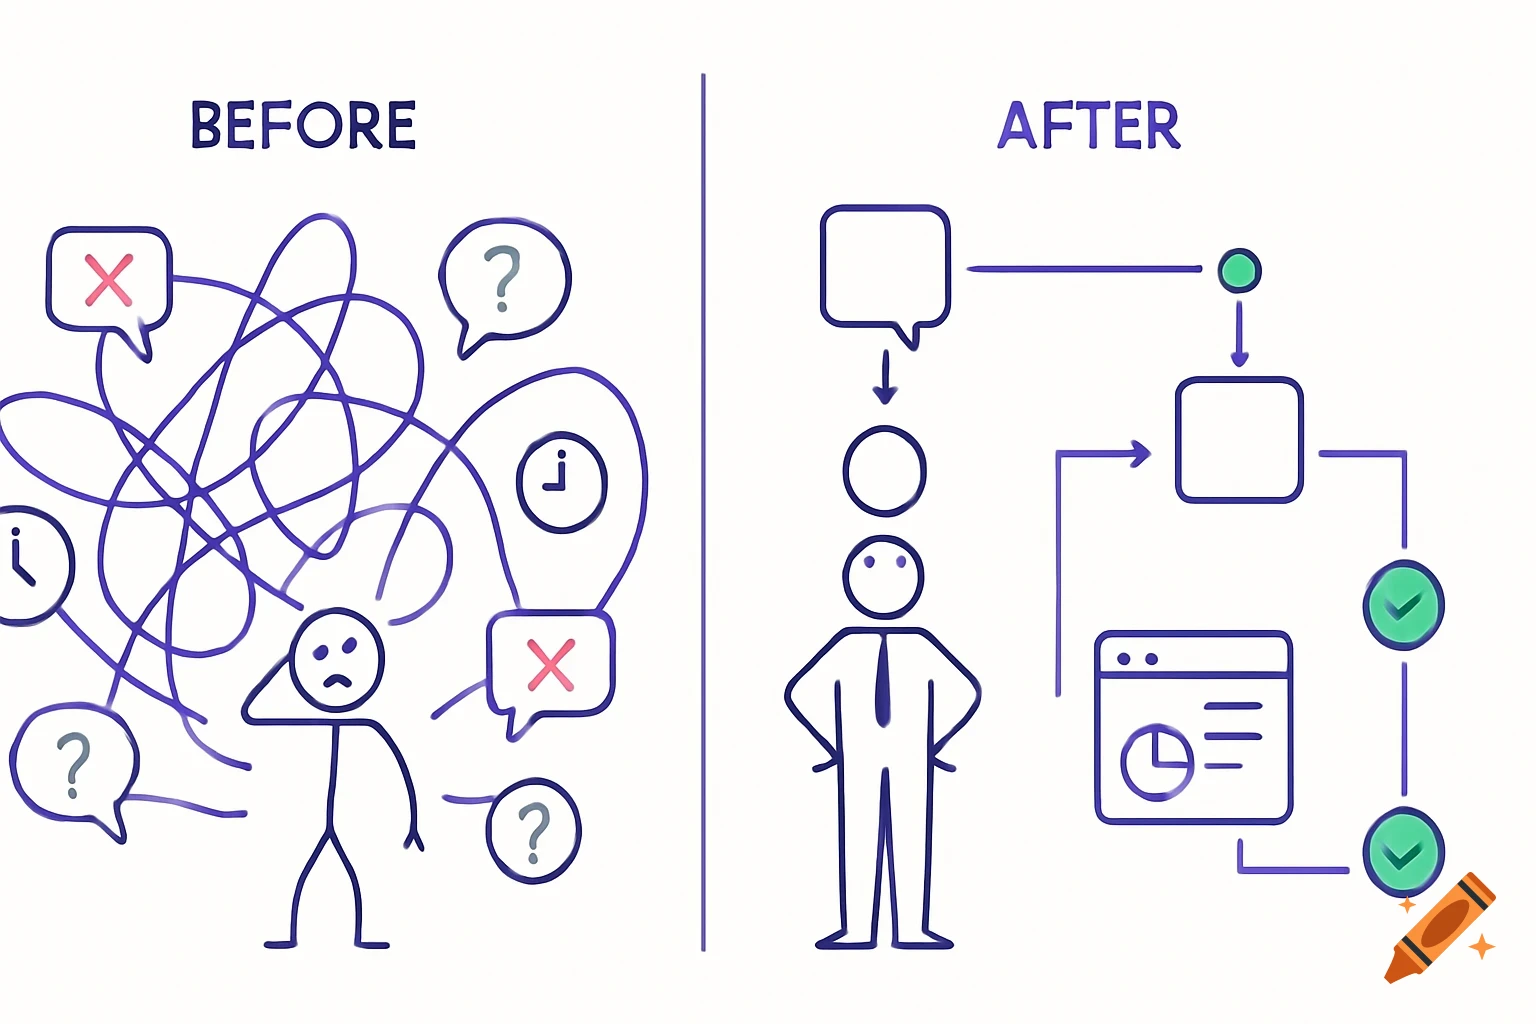
# Illustration Brief: Data to Insights to Action Journey ## Project Overview We need an illustration that visualizes the customer journey from "Data" to "Insights" to "Automated Outcomes" for a presentation about workflow automation. The illustration will be revealed in two stages during the presentation. ## Core Concept The illustration should show a clear left-to-right flow with three main stages: 1. **Data** (left) 2. **Insights** (middle) 3. **Automated Outcomes** (right) ## Two-Stage Reveal Requirement ### Stage 1: The Problem (Initial Slide) - Show the first two stages (Data → Insights) clearly connected and functioning - The third stage should show confusion/gap/problem: - Could be a question mark - Could be a confused person/character - Could be broken/incomplete connection - Could show manual chaos (sticky notes, overwhelmed person, etc.) - This should convey: "We're great at getting from data to insights, but then what?" ### Stage 2: The Solution (After Explanation) - Same illustration but now the third stage is complete - Shows smooth, automated flow to outcomes - The confusion is replaced with clarity and automation - Should feel like the "missing piece" has been added ## Visual Style Preferences - Modern, clean, professional - Should work well in presentations - Not too technical or intimidating - Approachable but enterprise-appropriate - Consider using consistent visual metaphors (pipes, roads, circuits, etc.) ## Specific Elements to Consider ### For "Data" See more