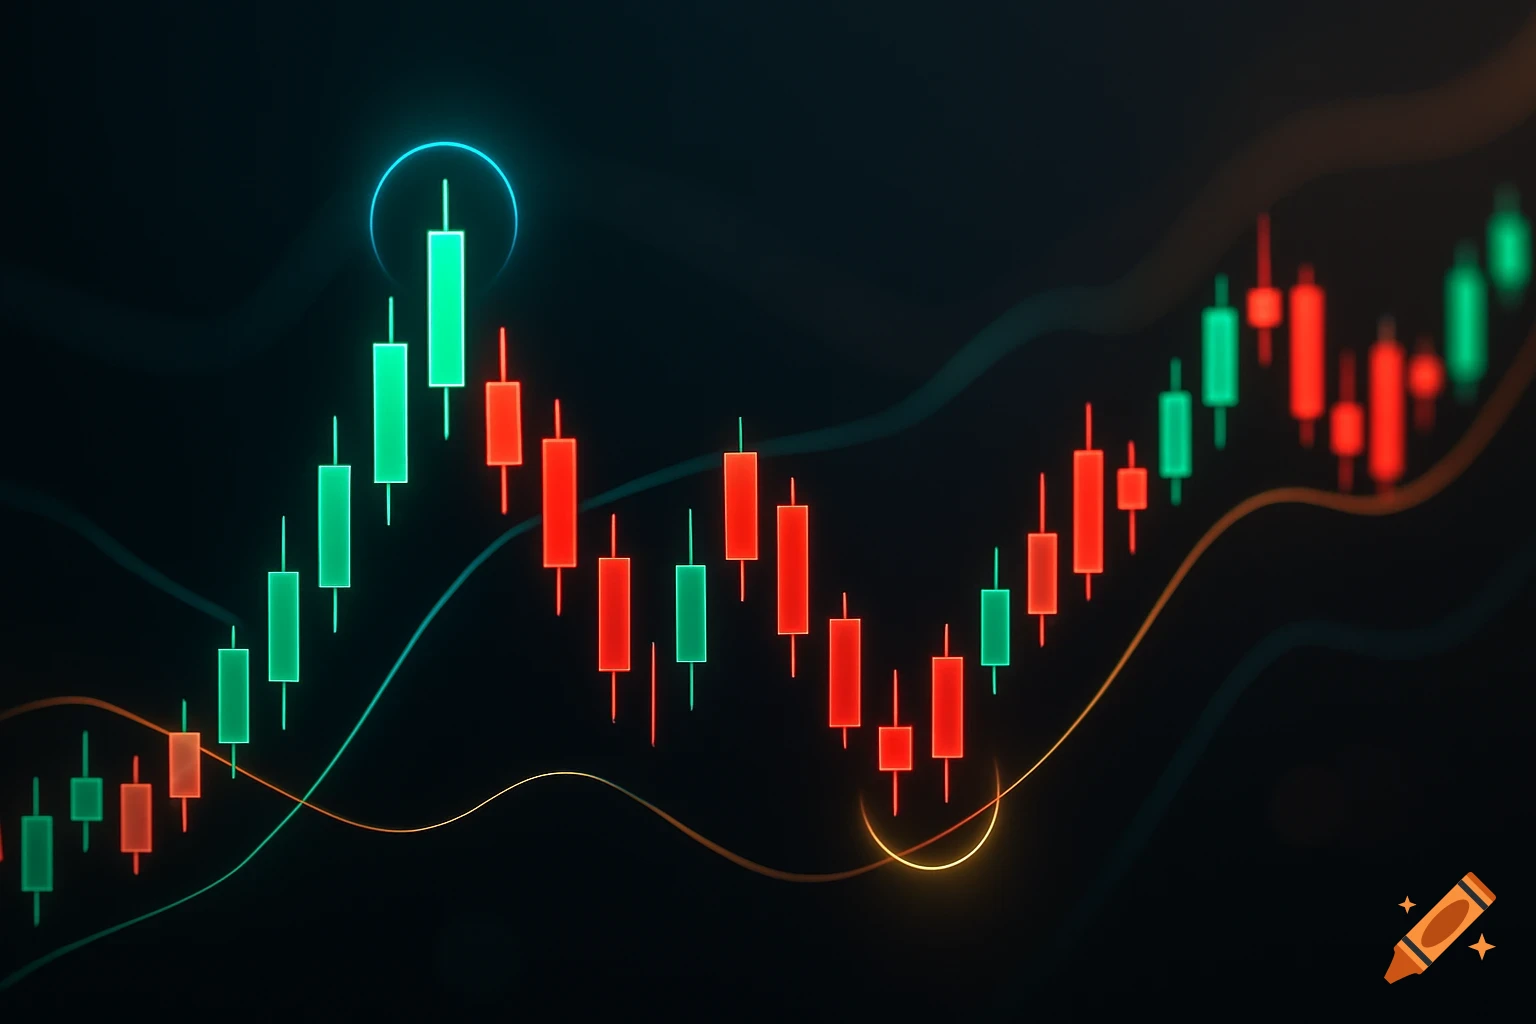
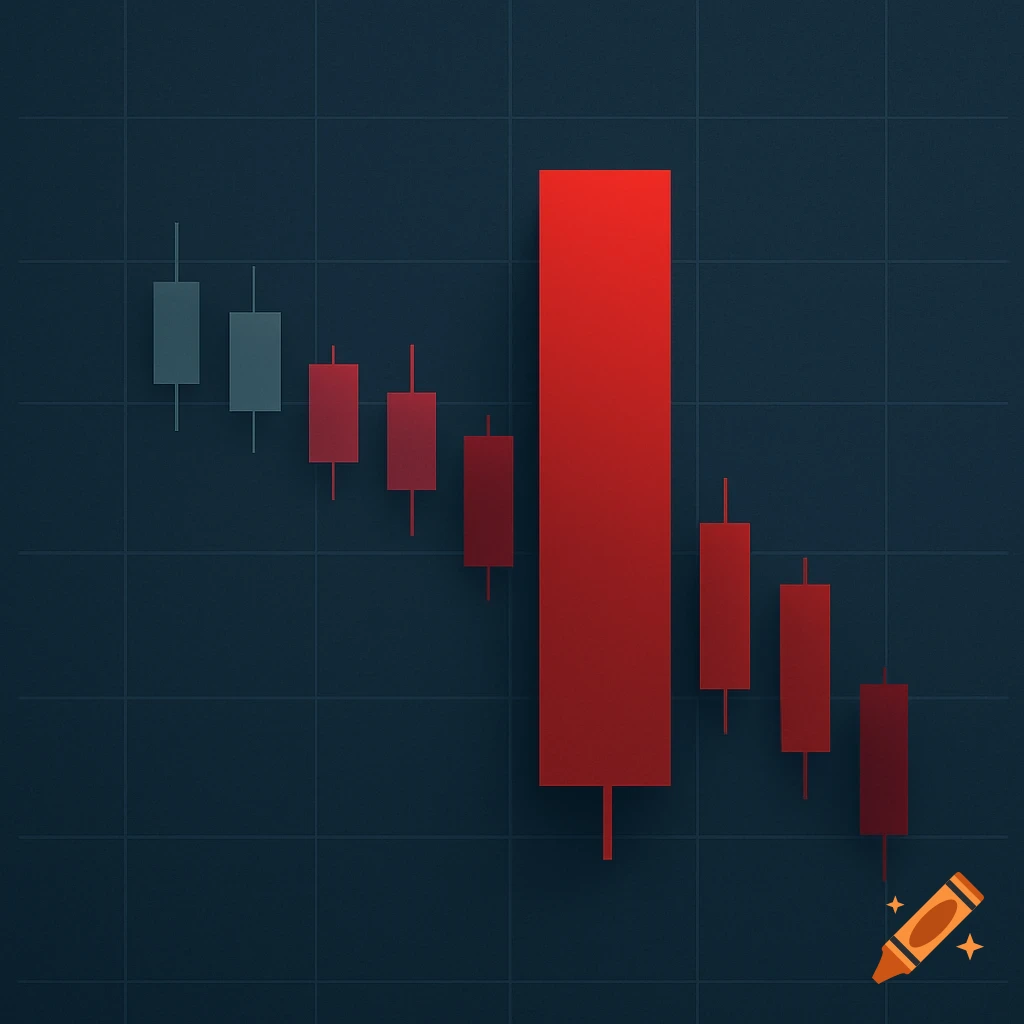
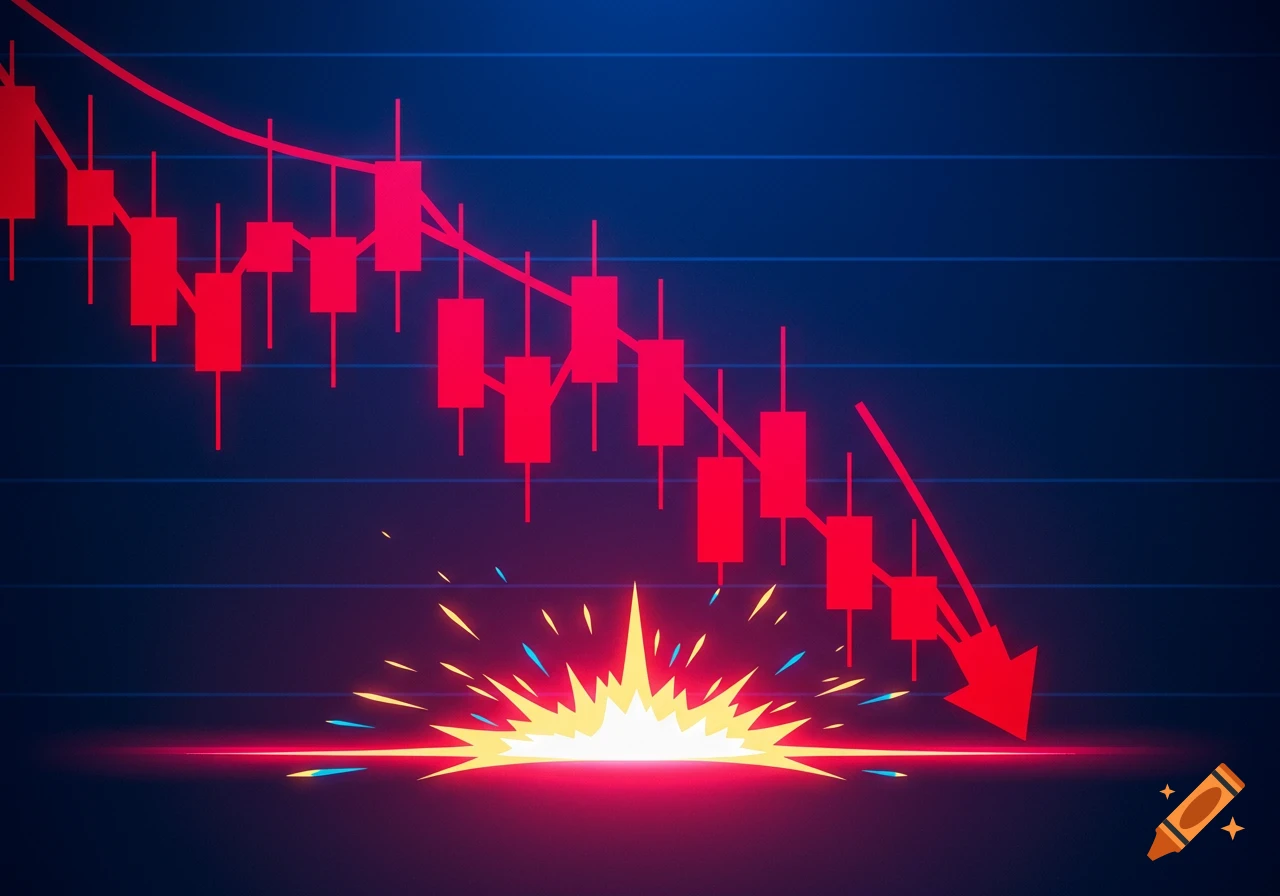
A dark trading view style financial candlestick chart depicting a strong bearish trend with red candles and downward-sloping moving averages.
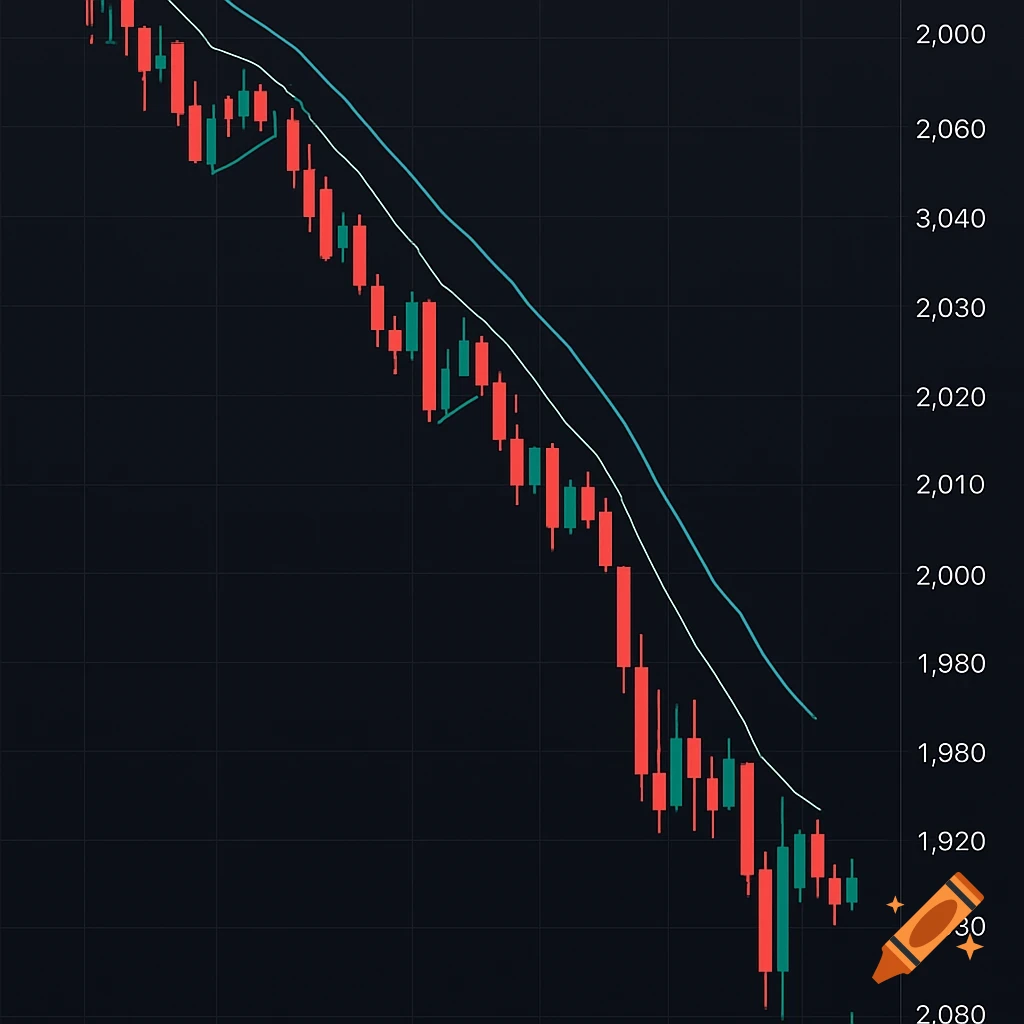
Synthetic illustrative 1-minute candlestick chart for Micro Gold Futures (MGC) on January 3, 2024. Dark TradingView-style background. Strong bearish trend throughout the session. Sharp impulsive red candles with momentum. Multiple small green pullbacks forming bear flags. Downward-sloping 9 EMA and 21 EMA hugging price. High volatility selloff into a capitulation low. Weak bounce and choppy consolidation after the low. Professional trading chart appearance. Realistic market microstructure. Clear gridlines, clean candles. NOT real data, illustrative reconstruction only. See more