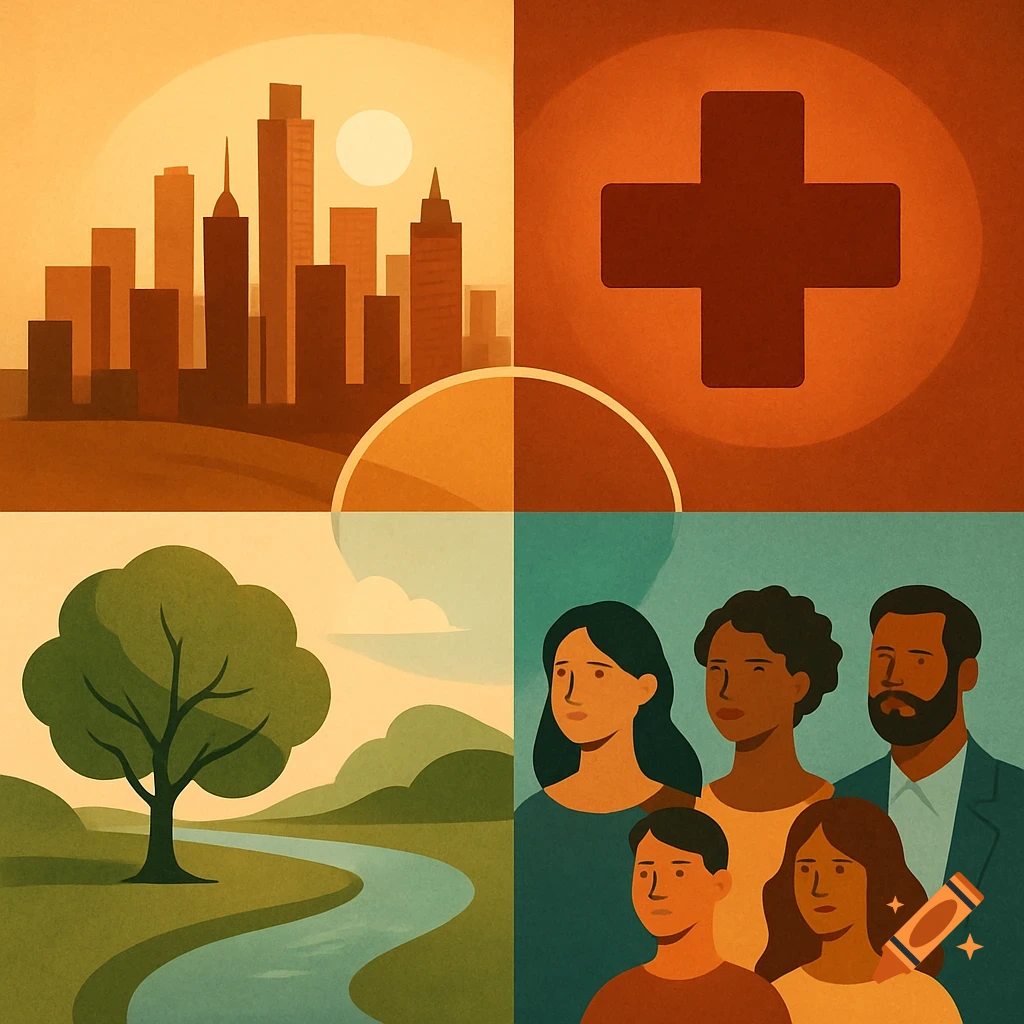
A four-quadrant infographic: Top left: A city skyline (to represent urban planning). Top right: A medical cross (to represent public health). Bottom left: A tree and river (to represent sustainability). Bottom right: A diverse group of people (to represent social equity). See more