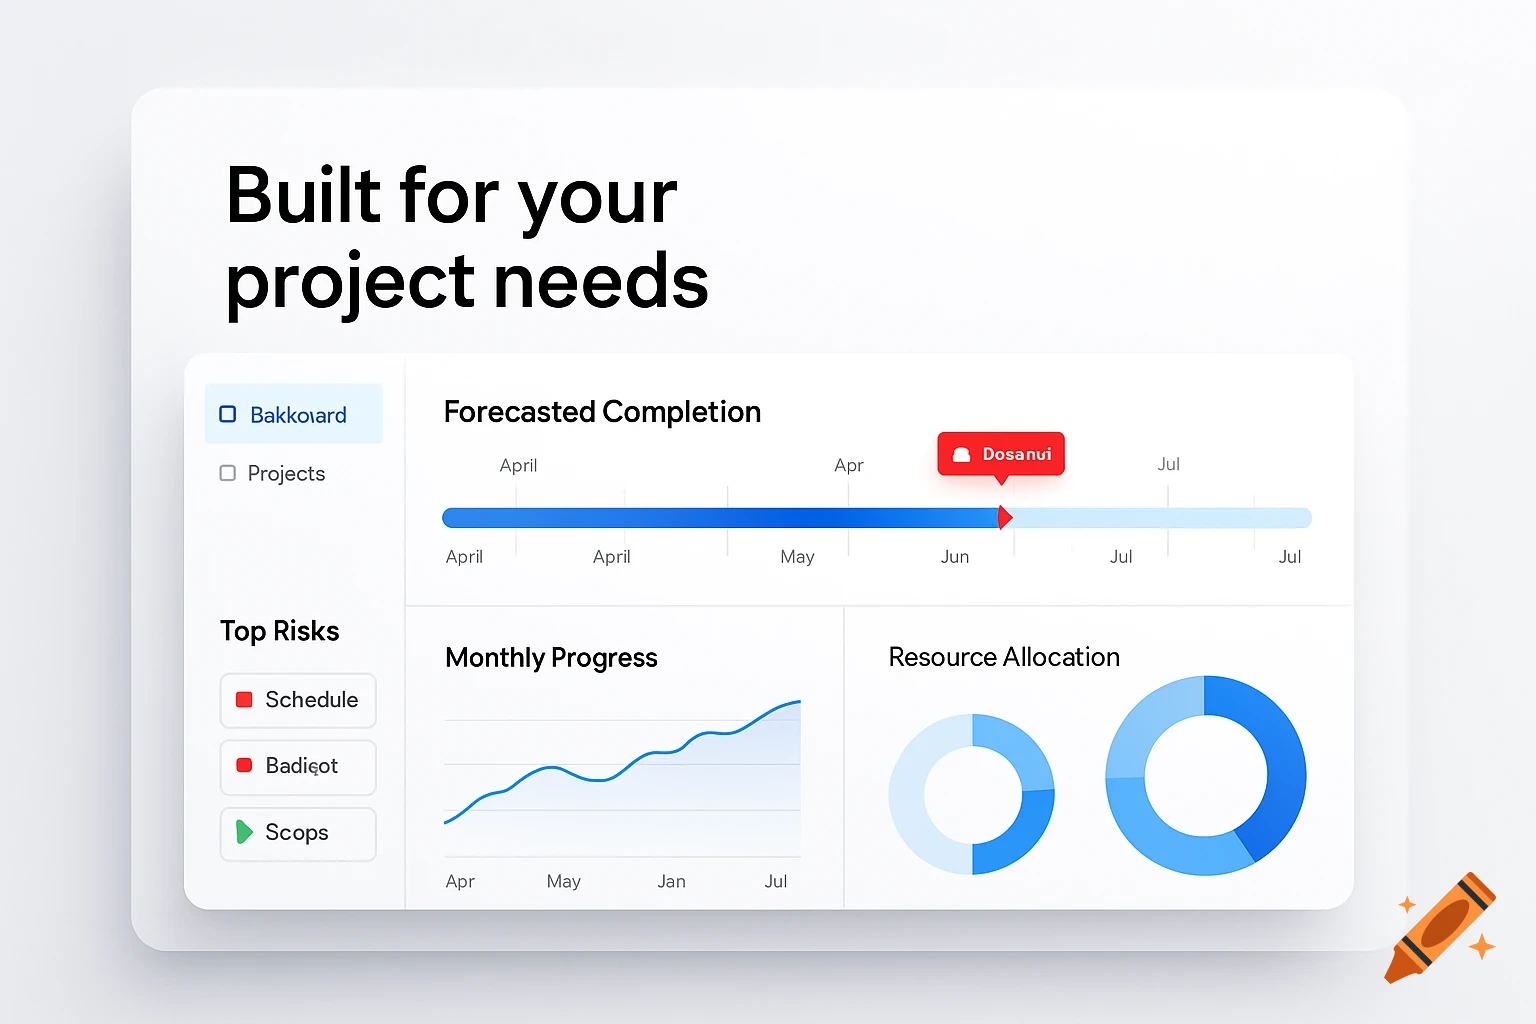
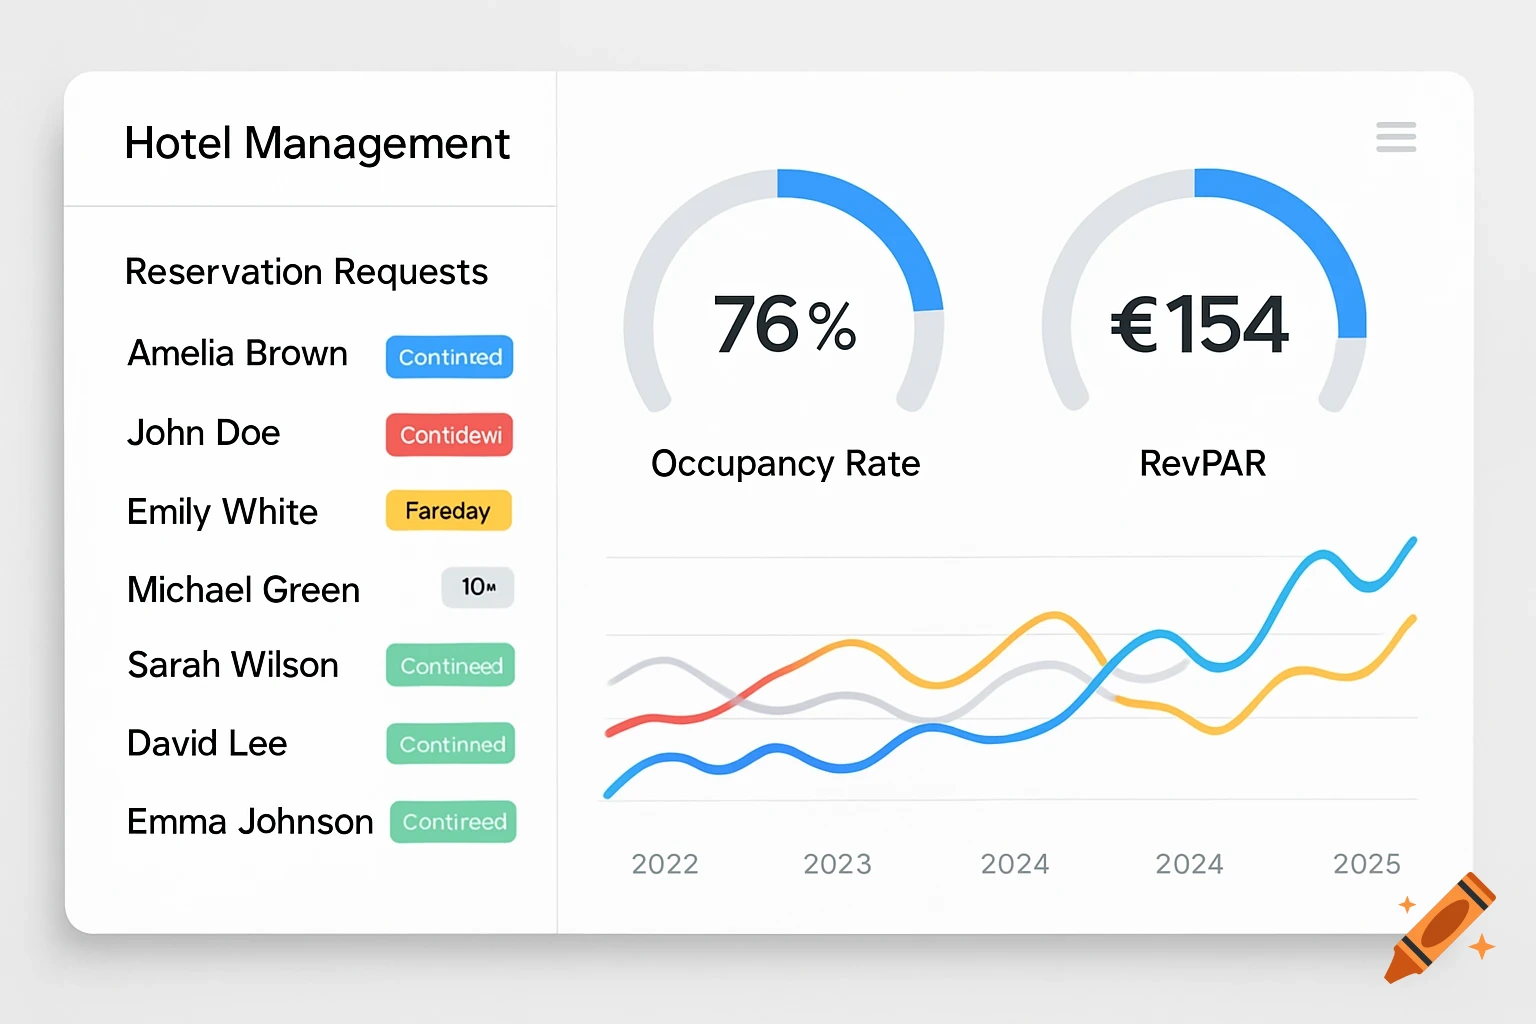
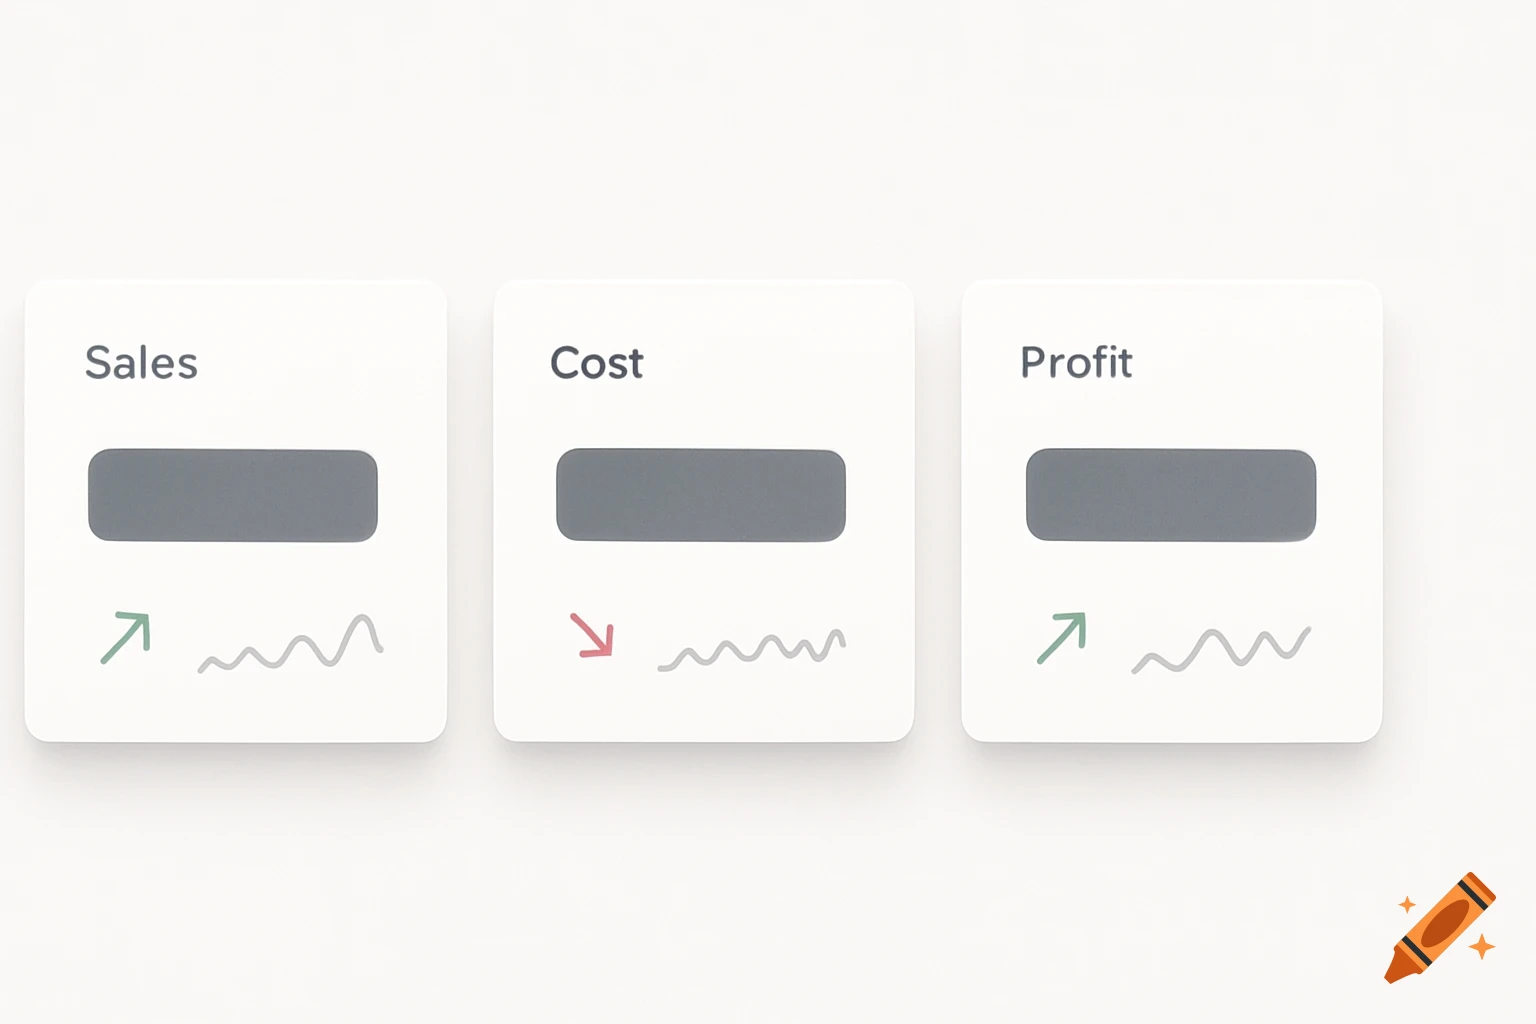
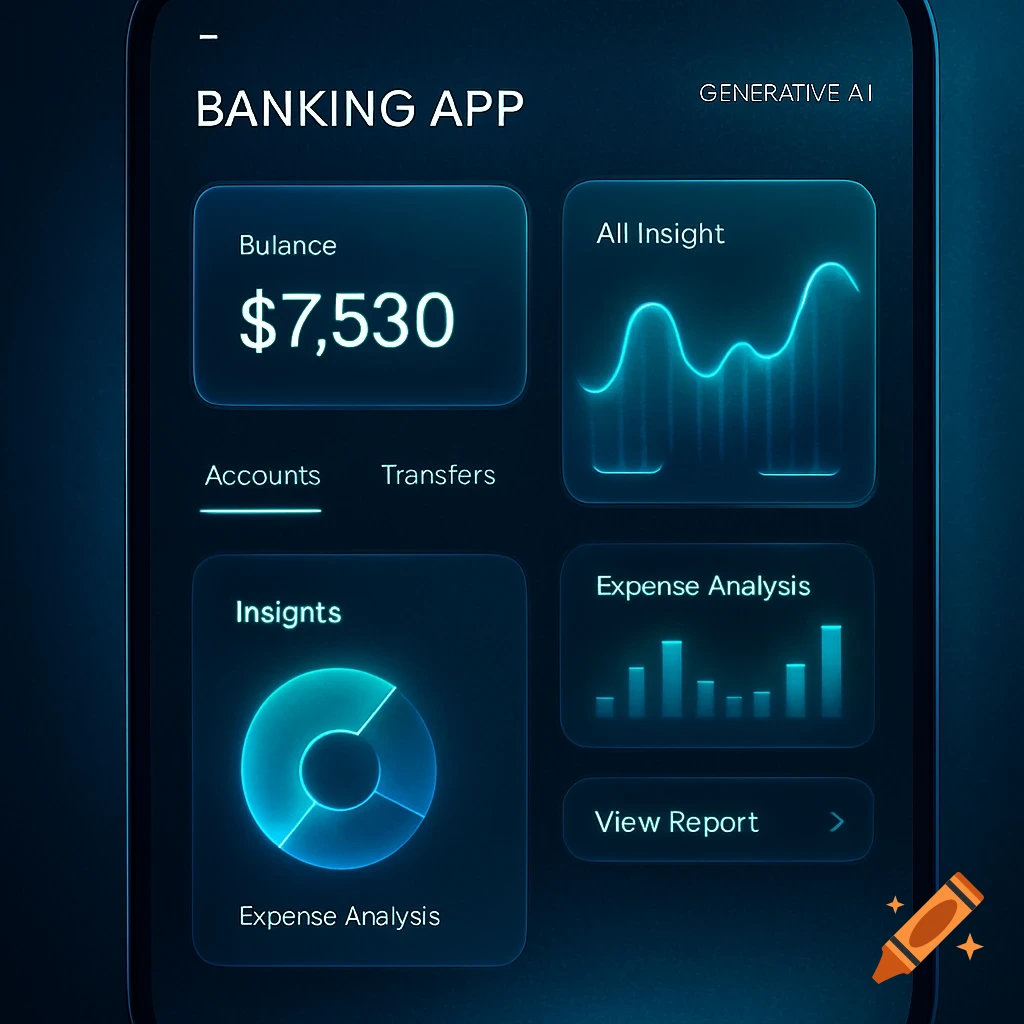
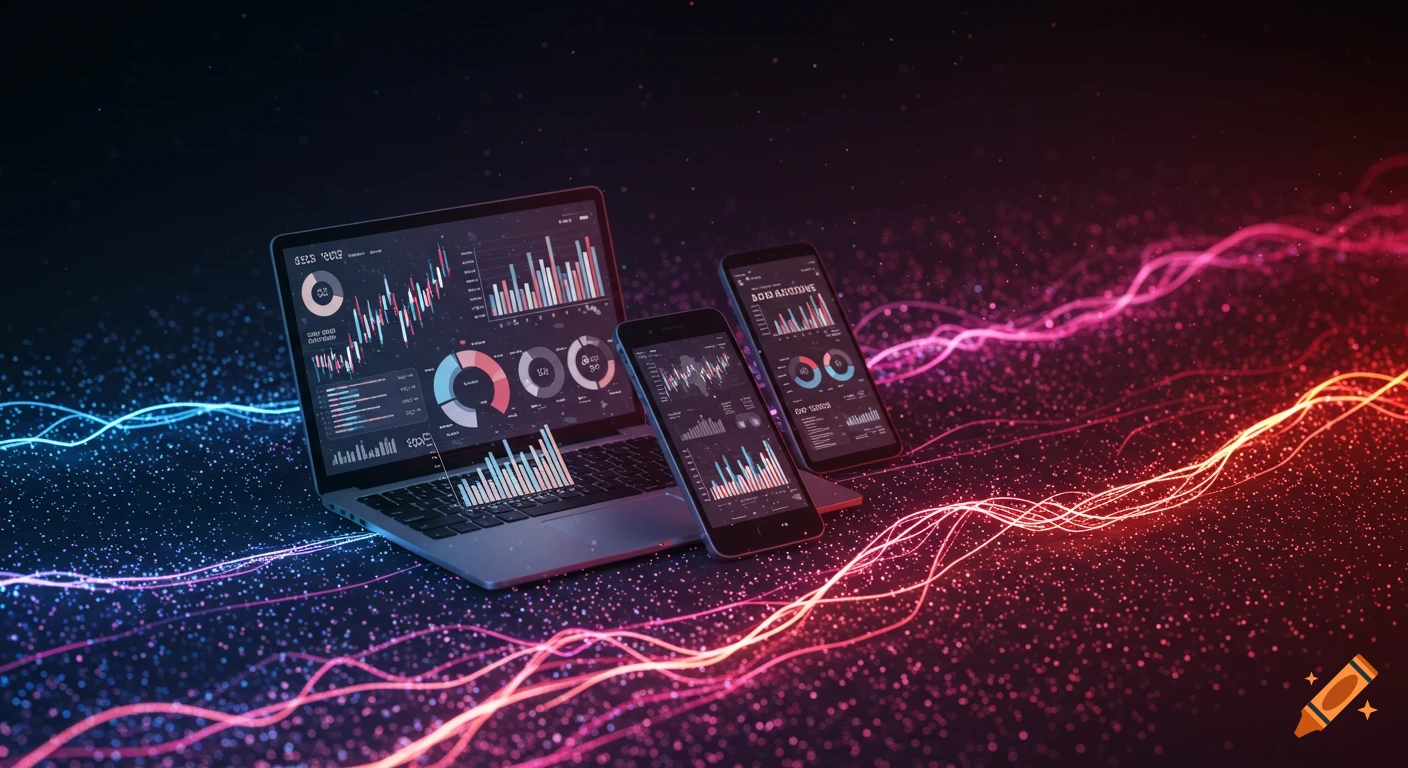
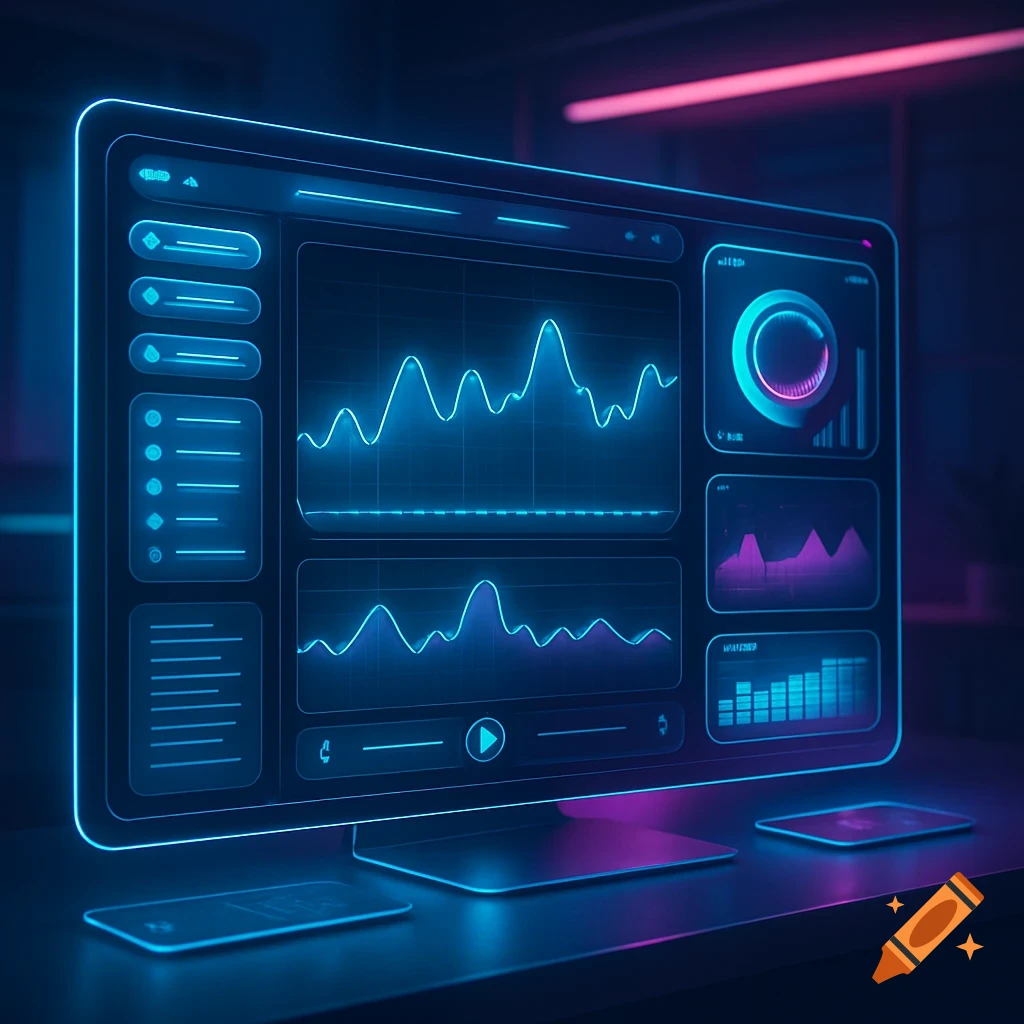
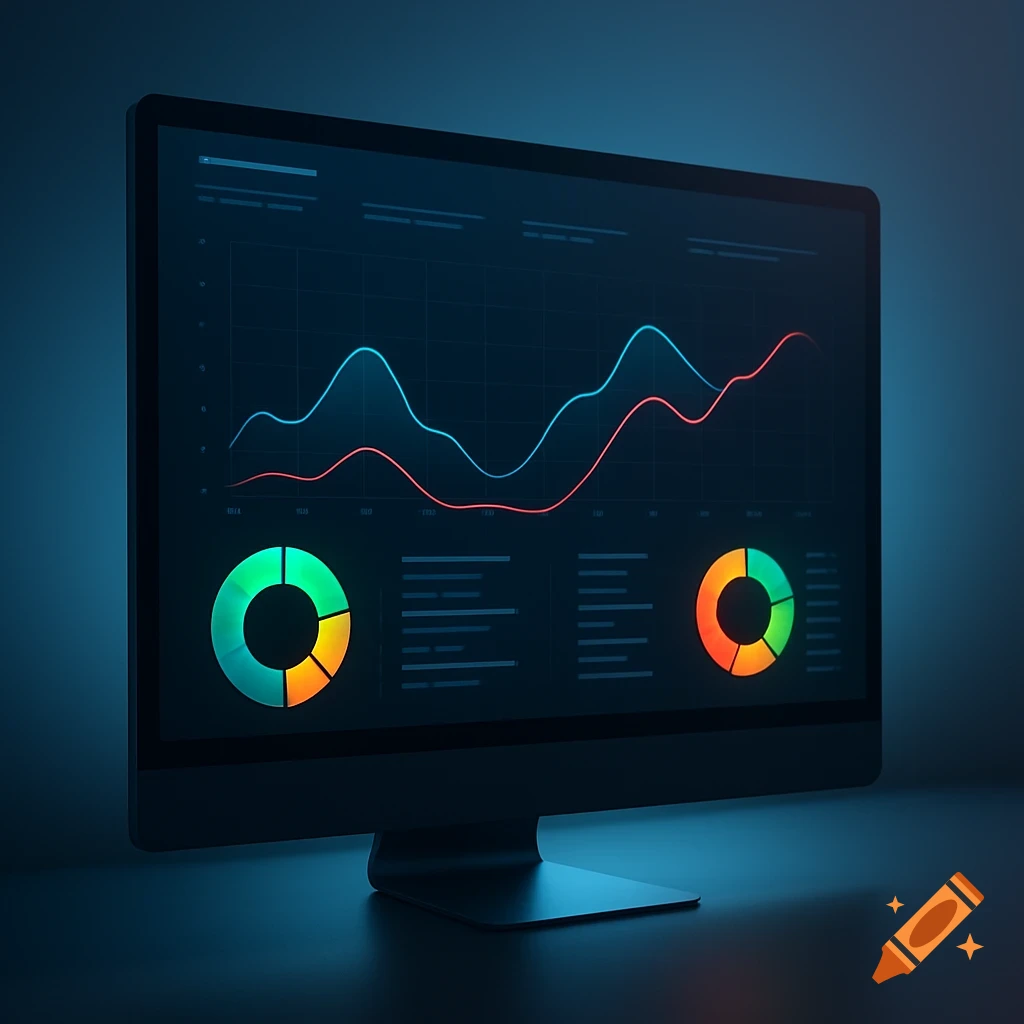
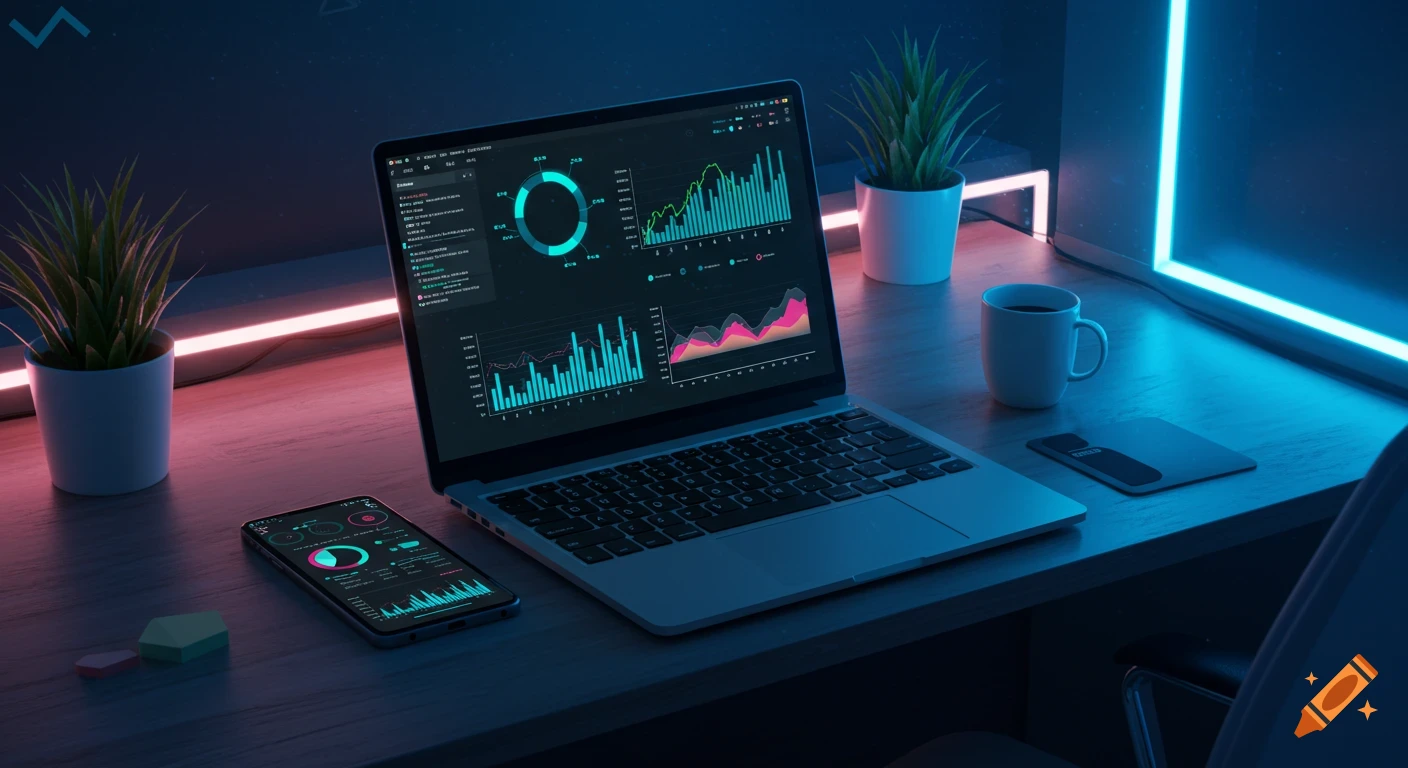
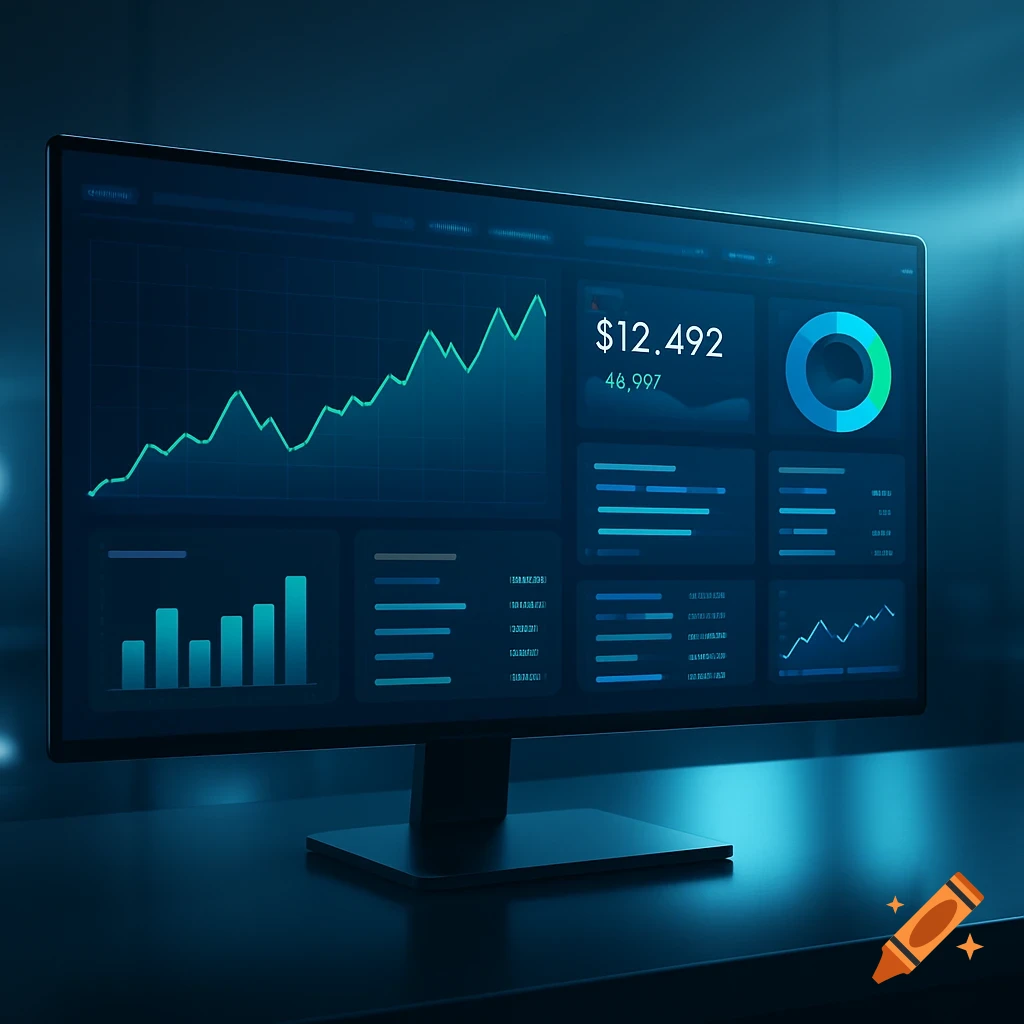
Analytics dashboard with graphs and charts showing viewer data, follower count, engagement stats, and revenue.
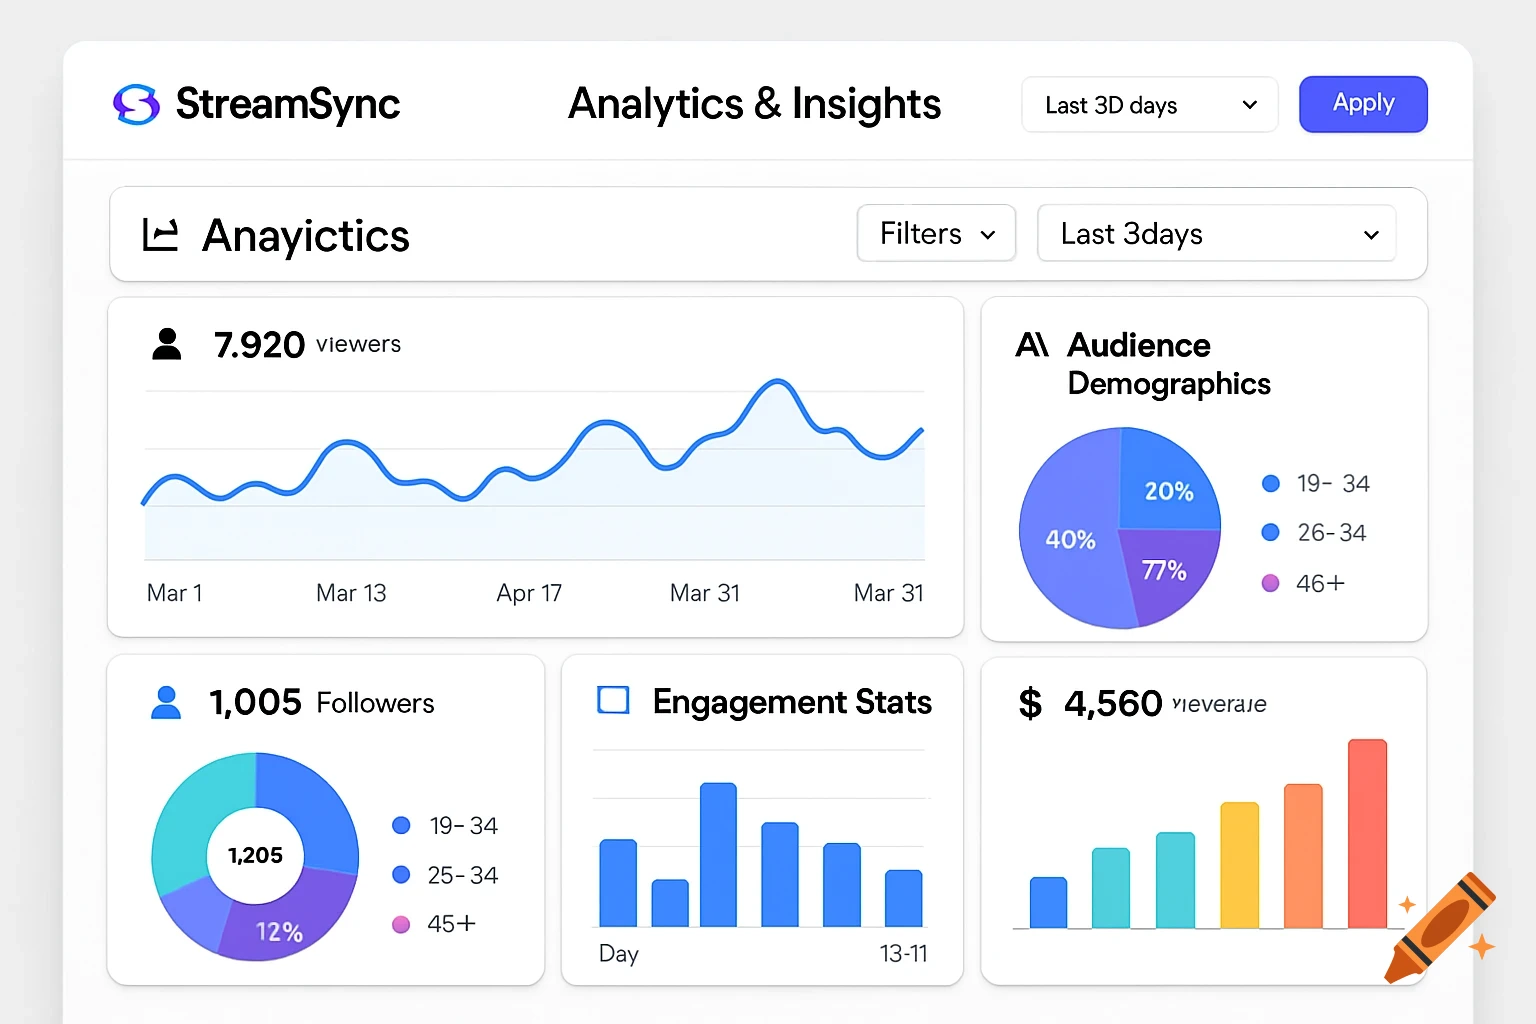
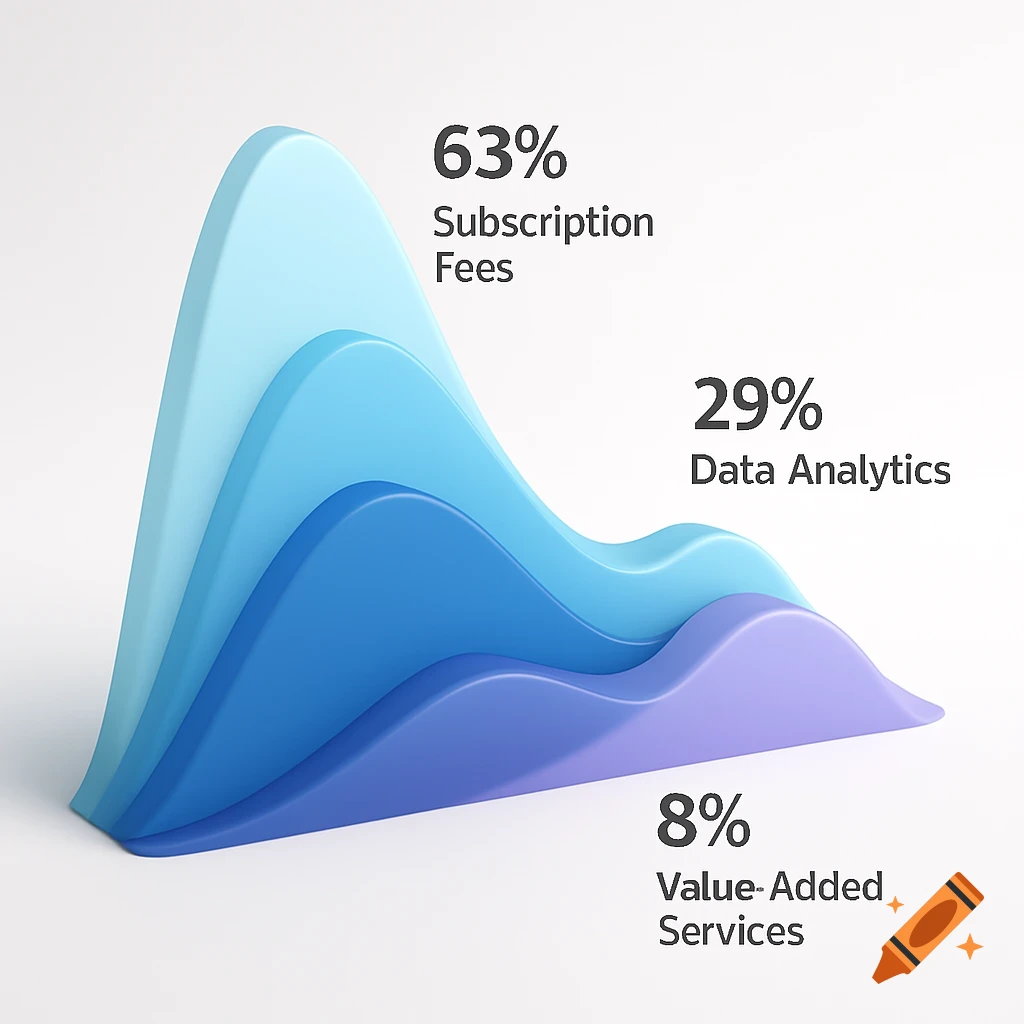
4. Analytics & Insights Page Description for AI Generator: "A detailed analytics page for StreamSync, showing data visualizations such as line graphs for viewer trends, pie charts for audience demographics, and bar graphs for engagement stats. The interface is modern and colorful, with filters and date range selectors at the top. The layout emphasizes clarity, with large data panels and icons indicating different metrics like viewers, followers, chat activity, and revenue. The background is clean and professional, highlighting data-driven insights." See more