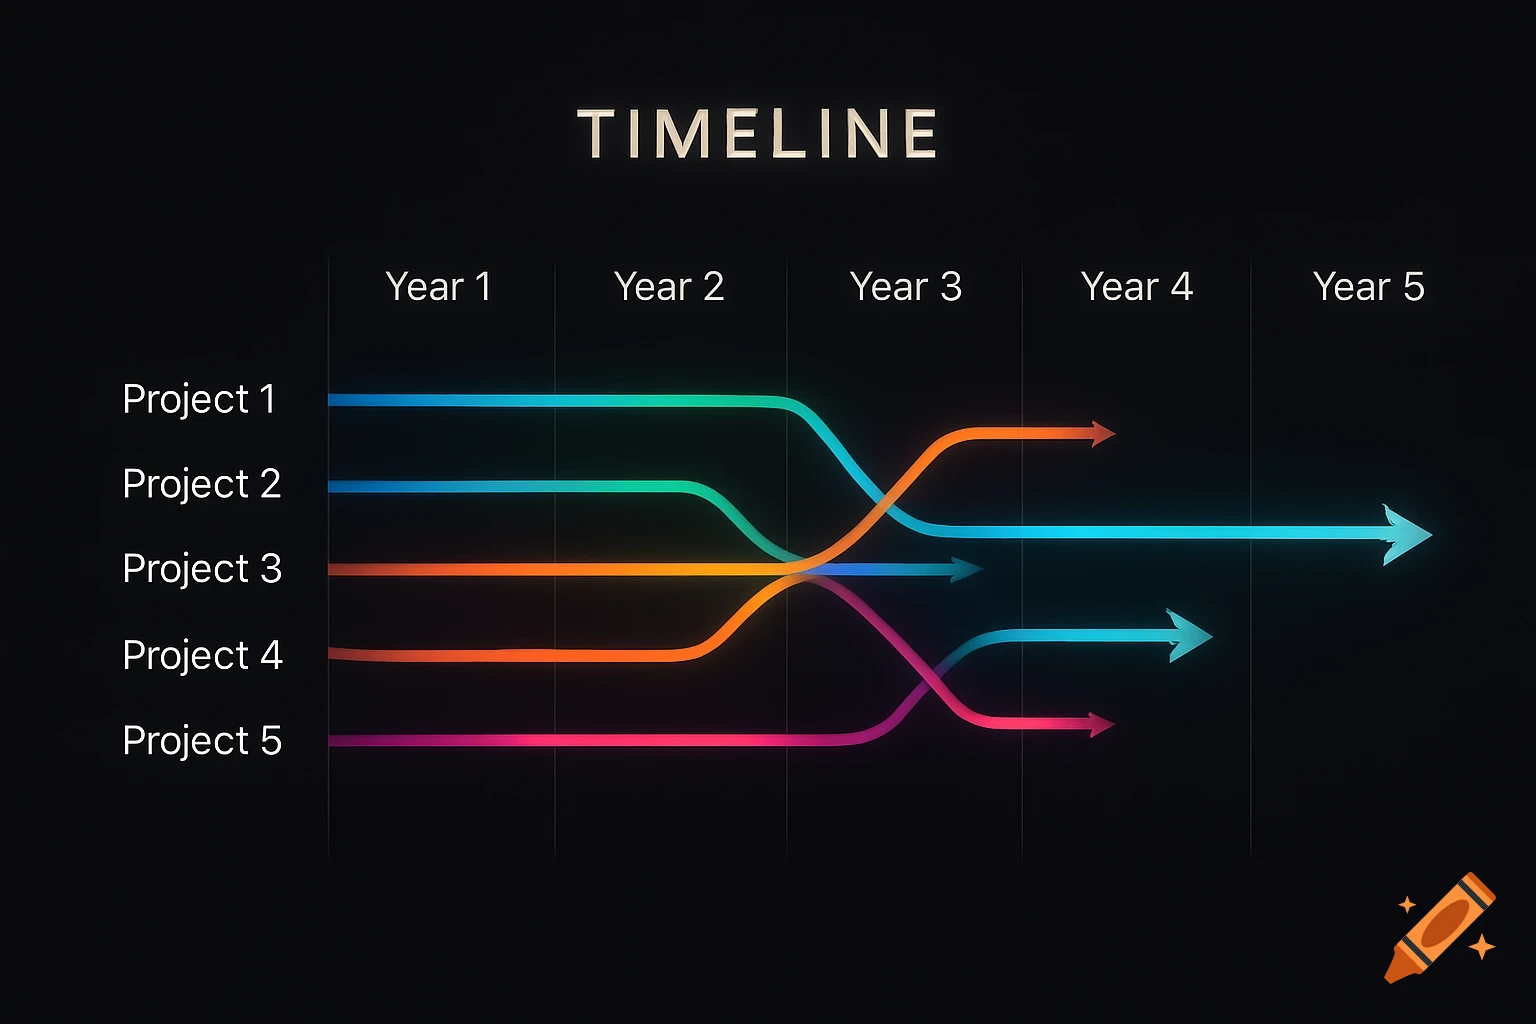
Gantt chart titled 'APPENDIX G: GANTT CHART FOR IMPLEMENTATION TIMELINE' showing task durations over months.
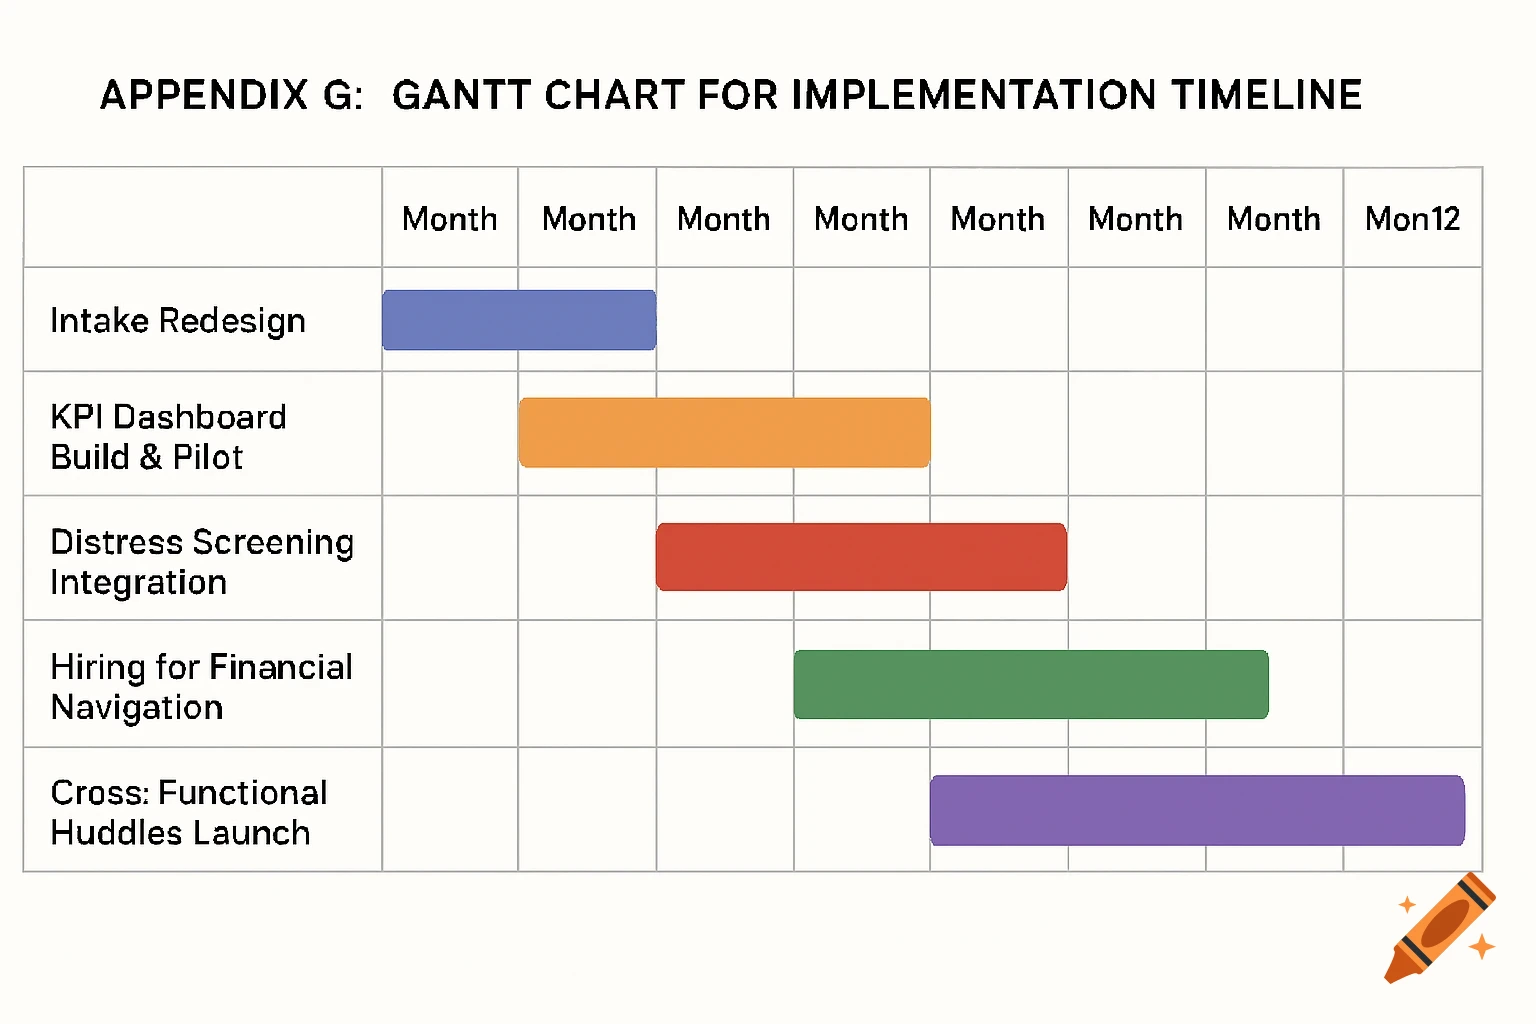
APPENDIX G: GANTT CHART FOR IMPLEMENTATION TIMELINE • Gantt chart image or table indicating timeline phases and task durations for the five key projects. Project Phases (Month 1–12): • Intake Redesign: M1–M3 • KPI Dashboard Build & Pilot: M2–M6 • Distress Screening Integration: M1–M4 • Hiring for Financial Navigation: M5–M9 • Cross-Functional Huddles Launch: M6–M12 (Visual: Bar chart or timeline view with milestones and color-coded initiatives.) See more