An orange and blue infographic illustrating budget distribution across three phases with percentages and icons for start, optimization, and peaks.
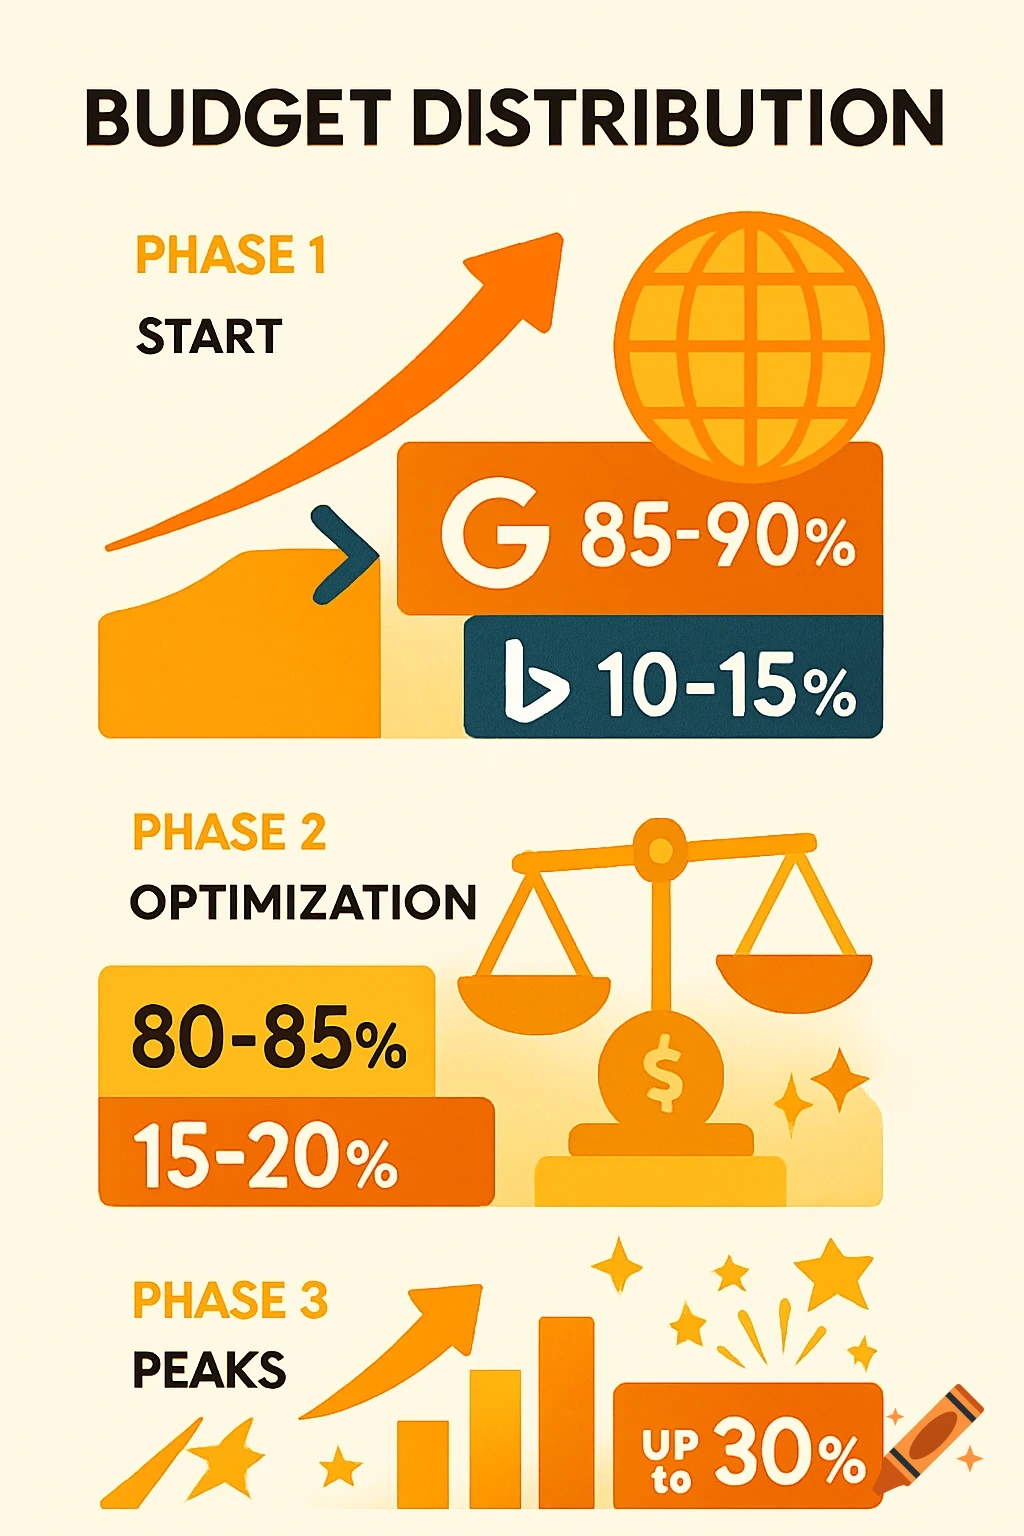
Empfohlene Budgetverteilung Google & Bing (Start → Optimierung → Peak)“ Phase Google Bing Nutzen Phase 1 – Start 85–90 % 10–15 % sofort inkrementelle Reichweite, Brand-Präsenz breit Phase 2 – Optimierung 80–85 % 15–20 % stabile Performance → Bing günstiger, zusätzliche Nutzer Phase 3 – Peaks 70–80 % 20–30 % maximaler Traffic, Push für Themen/LPs See more