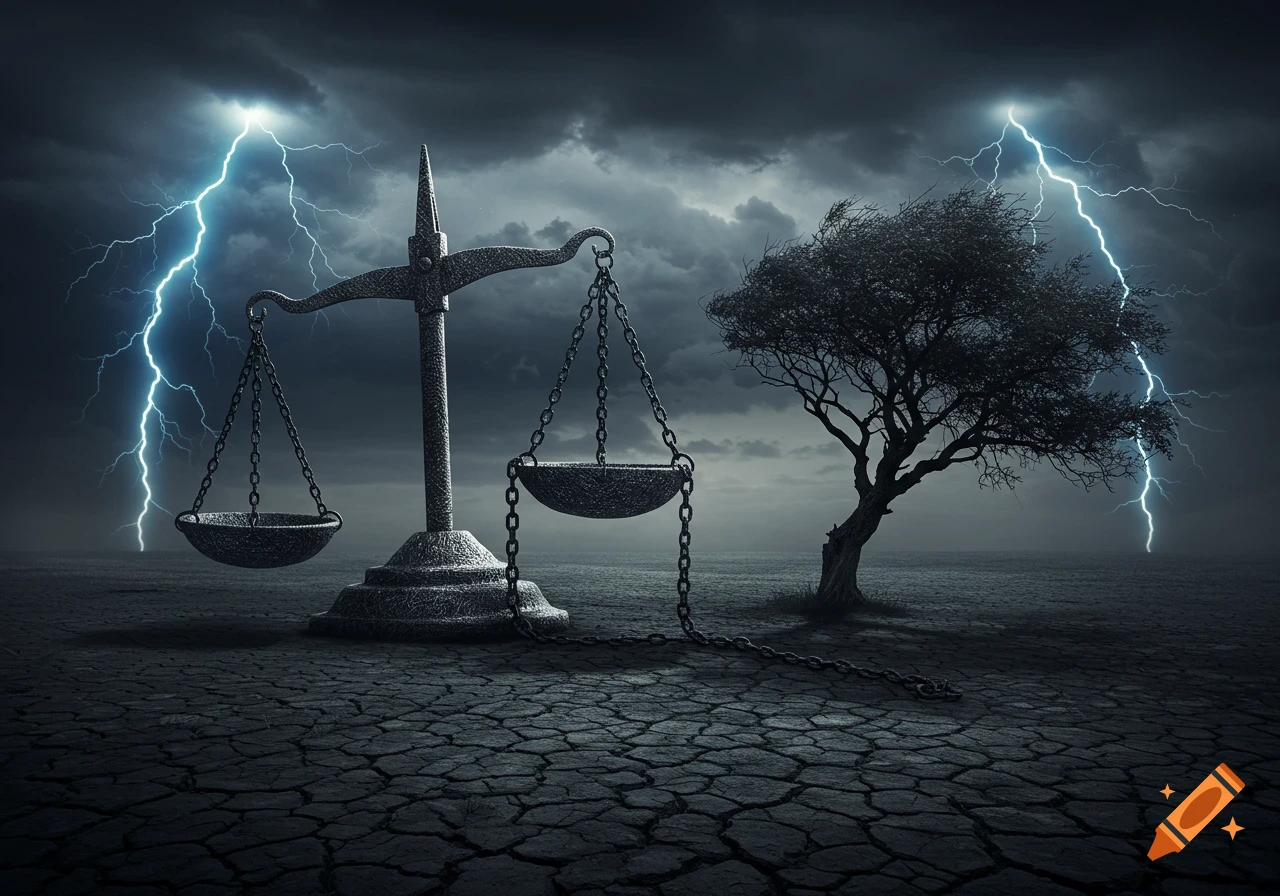
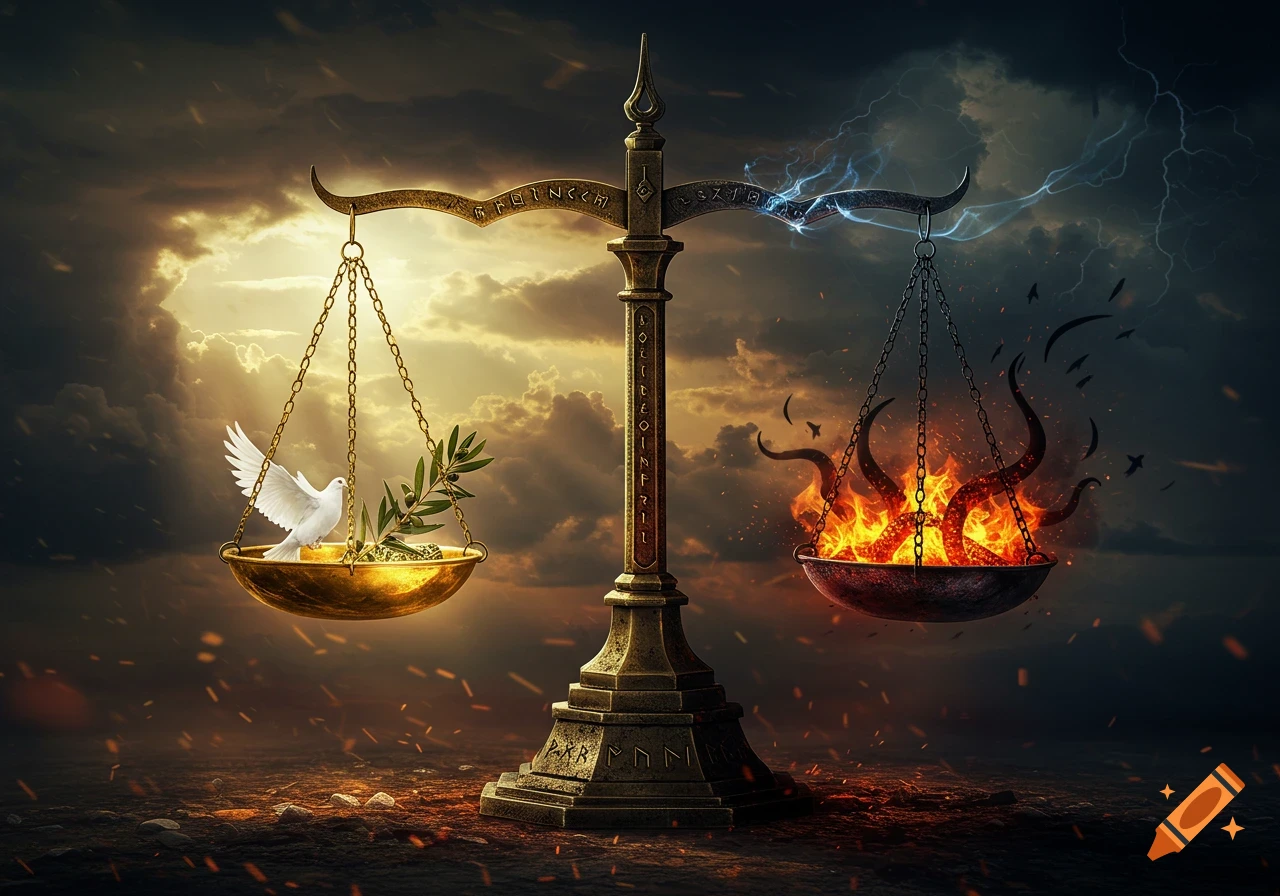
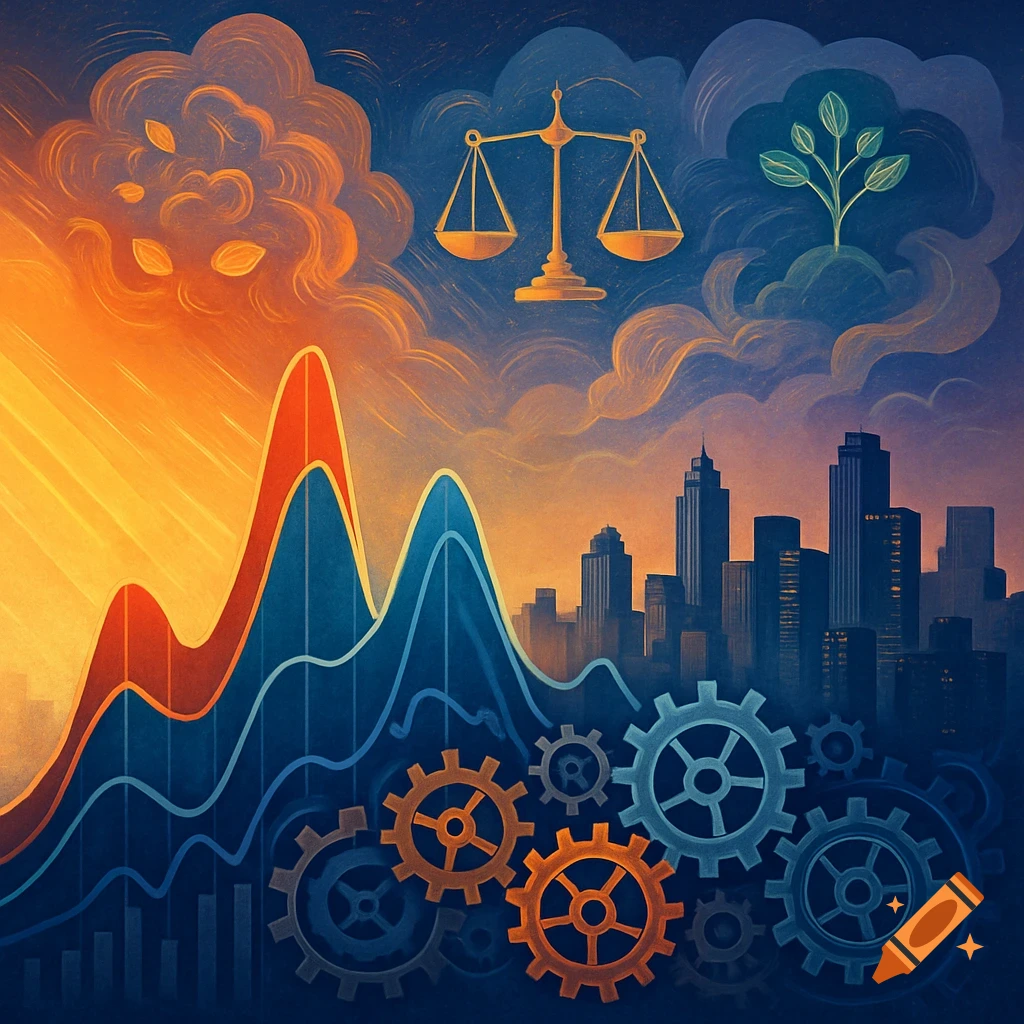
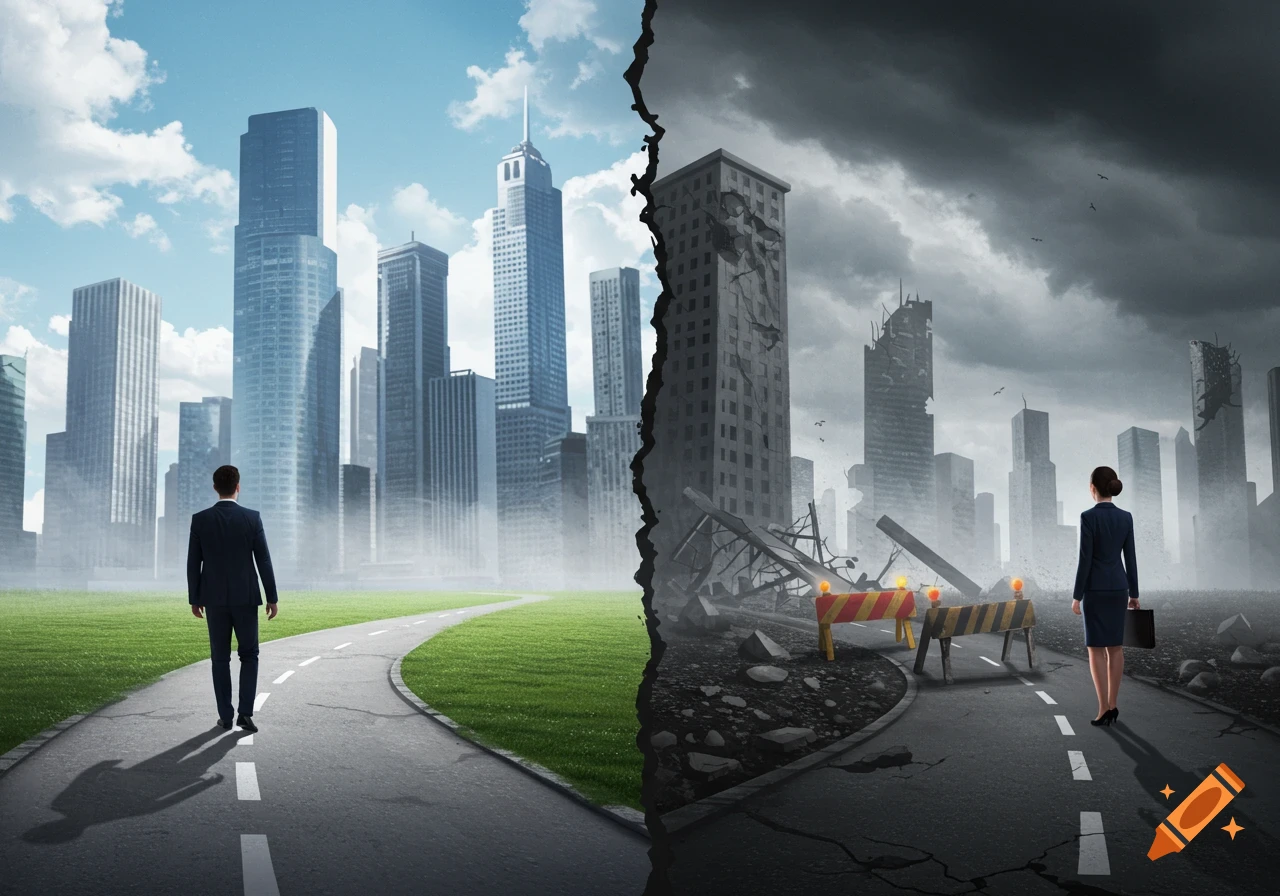
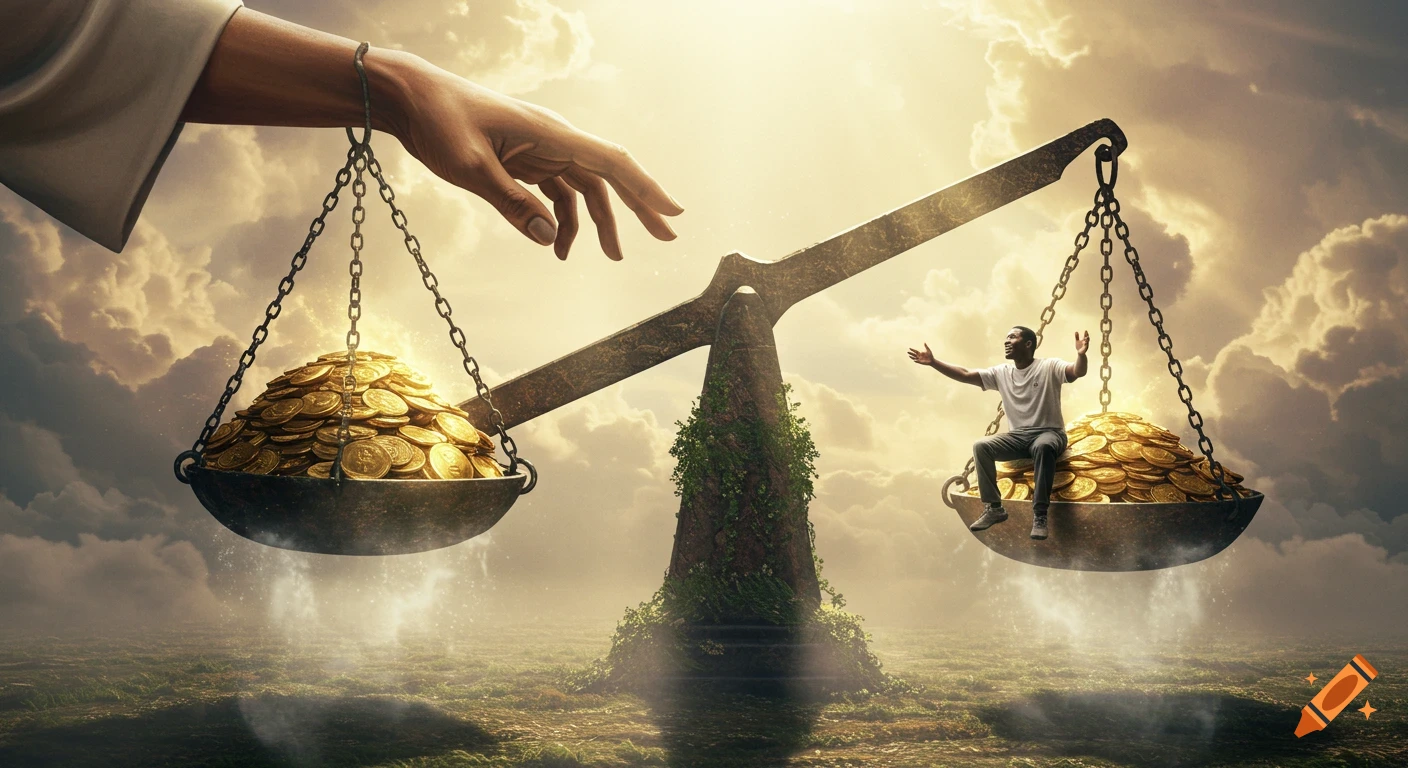
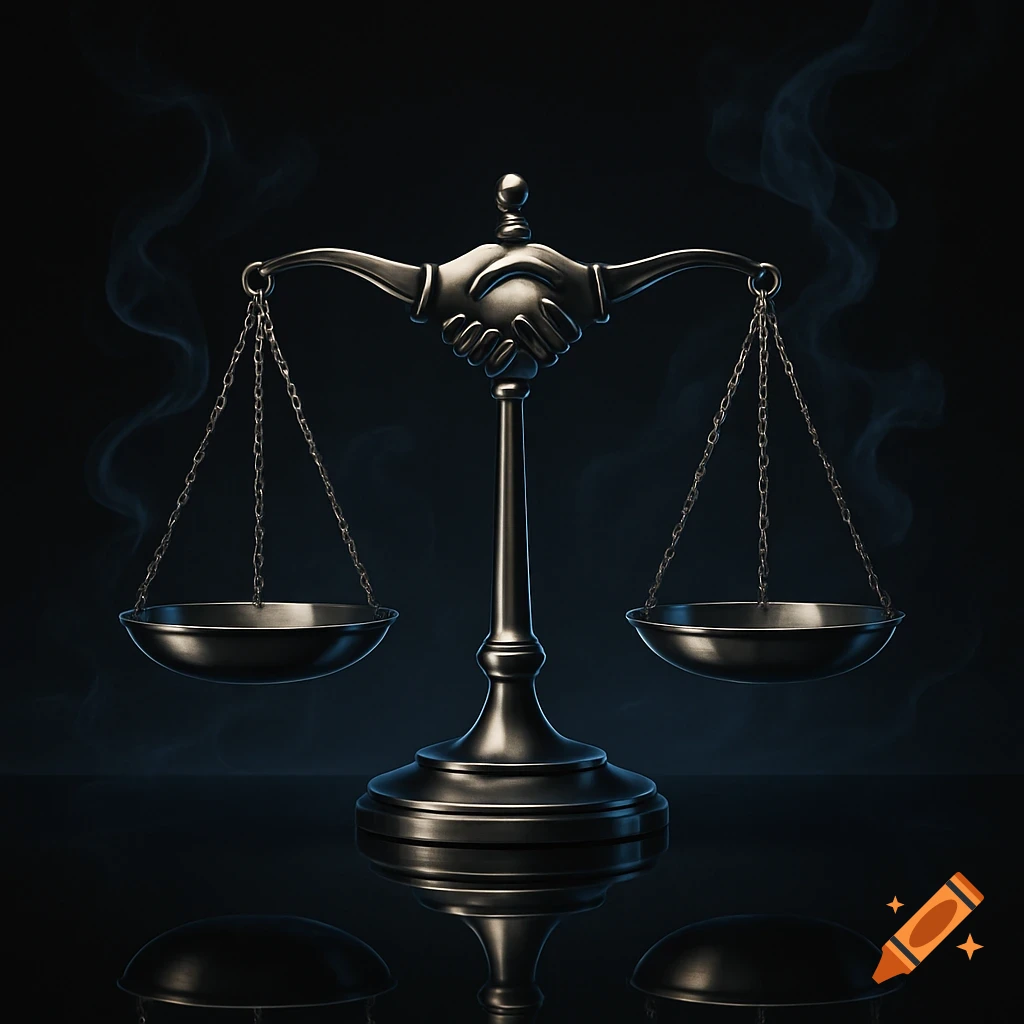
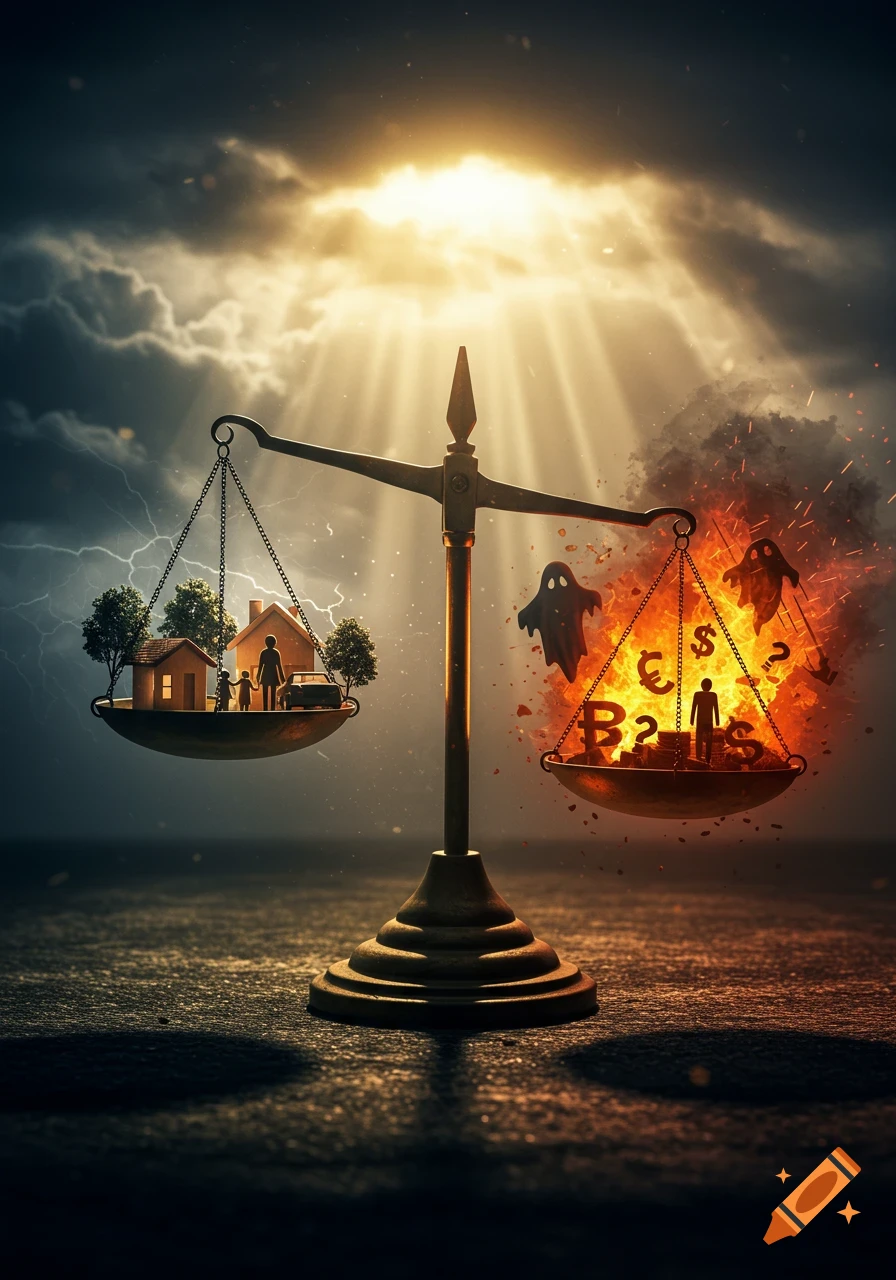
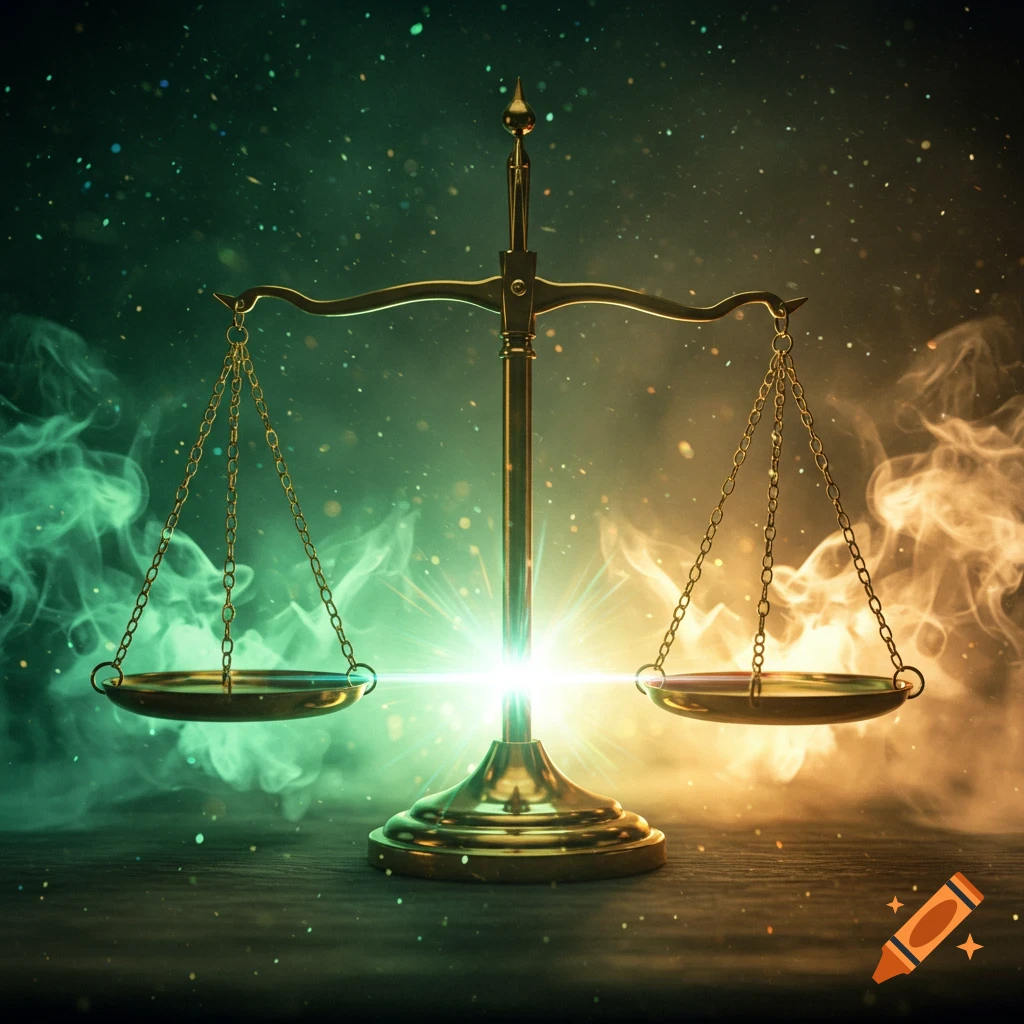
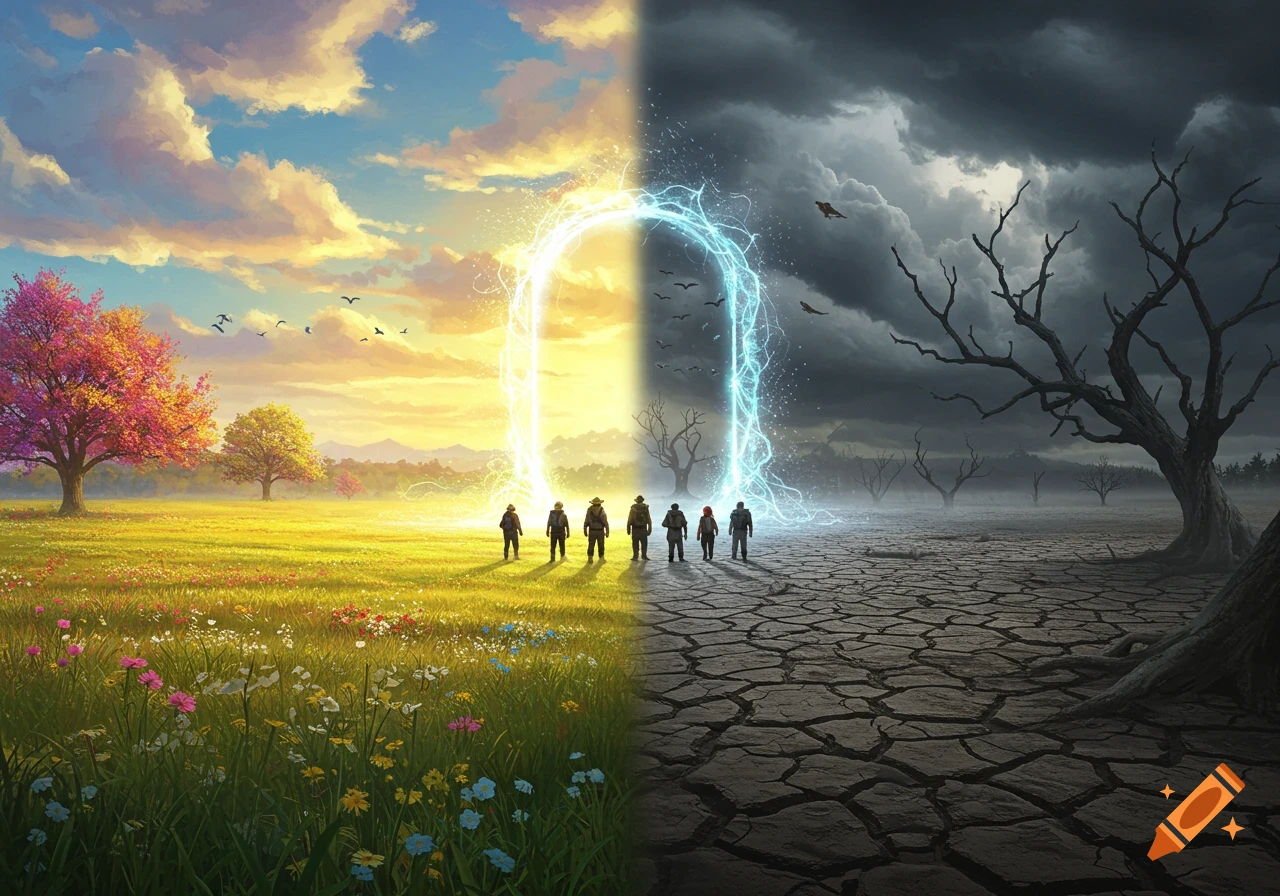
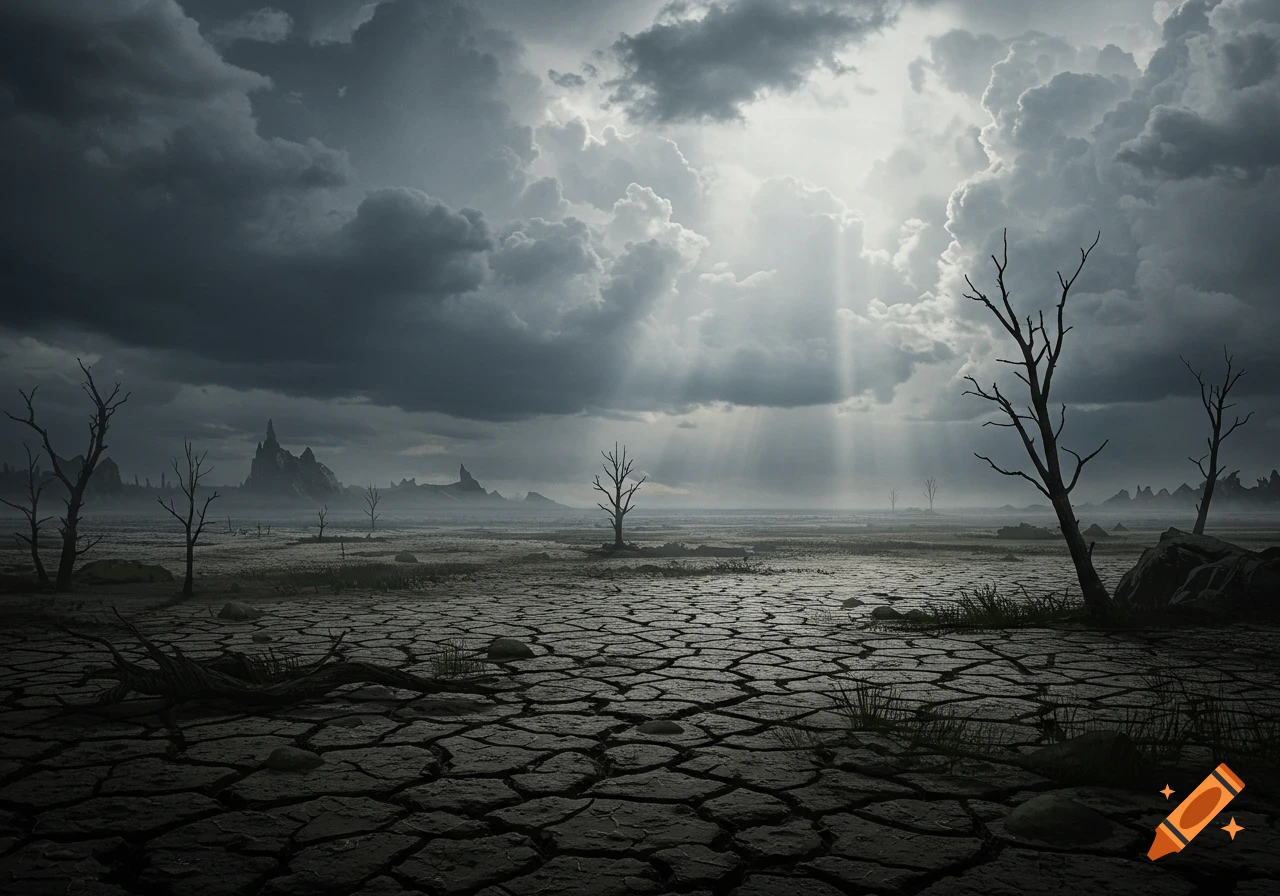
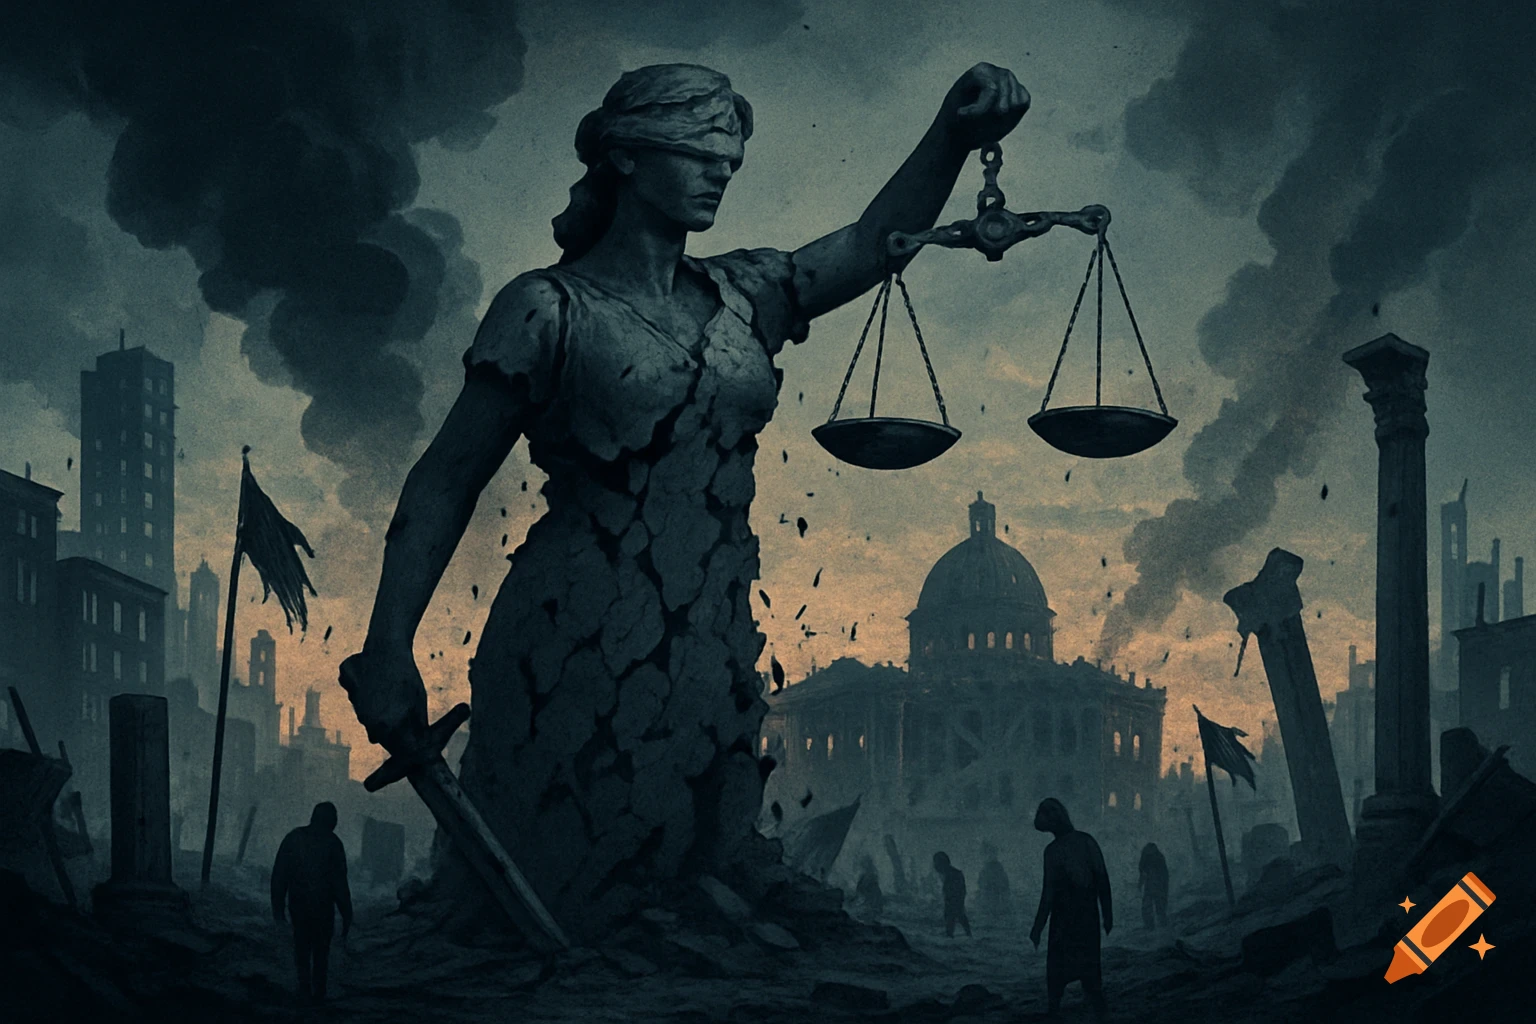
Brass scales balance 'RESILIENCE' and 'VULNERABILITY' against a dramatic stormy sky and cracked earth, painted style.
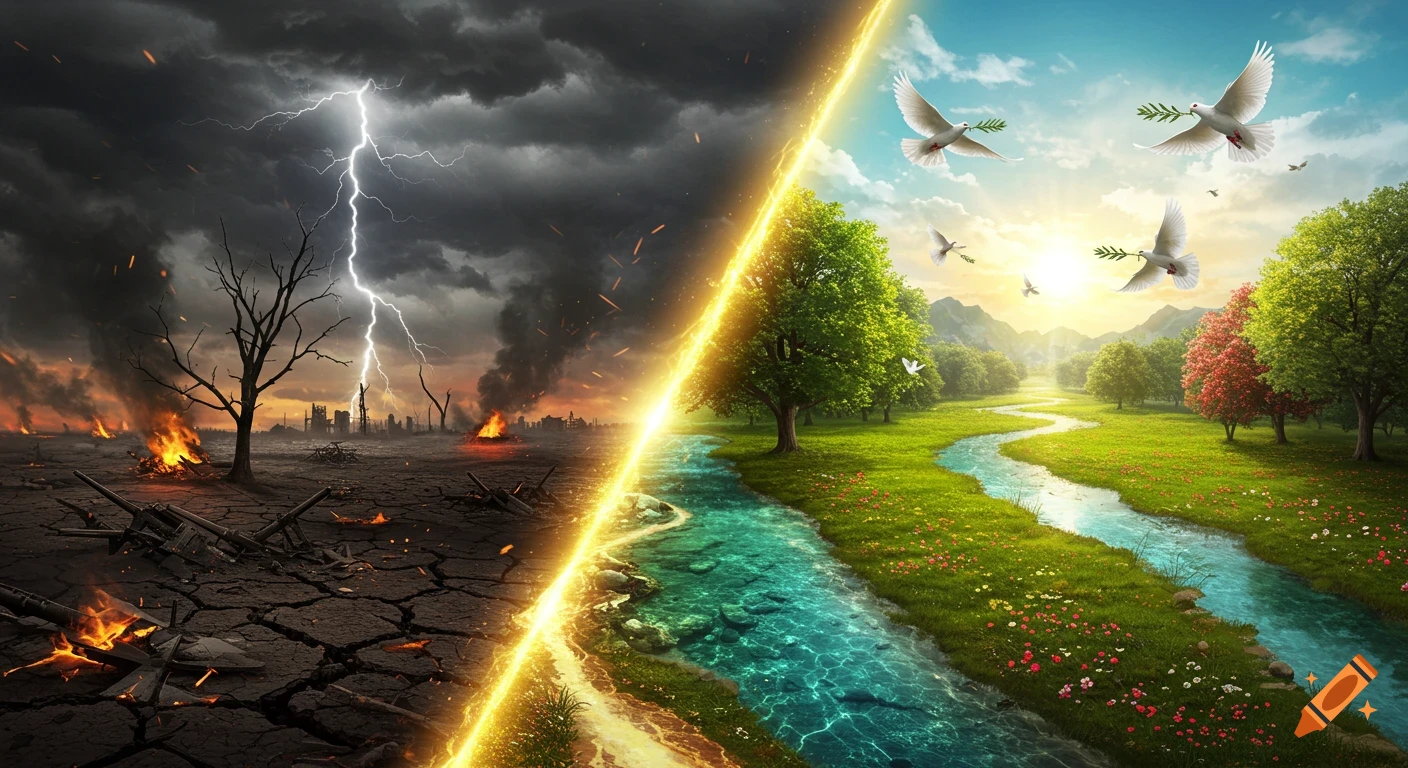
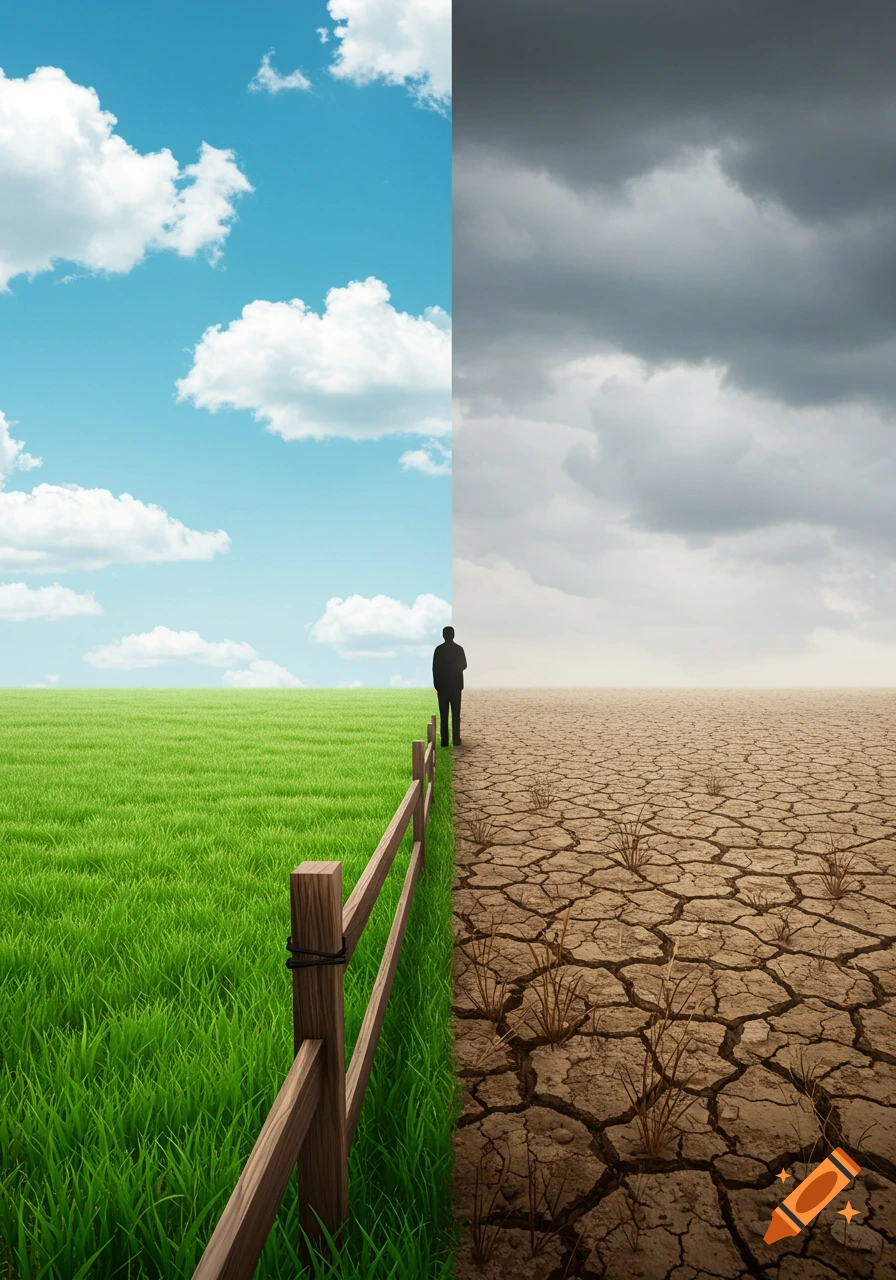
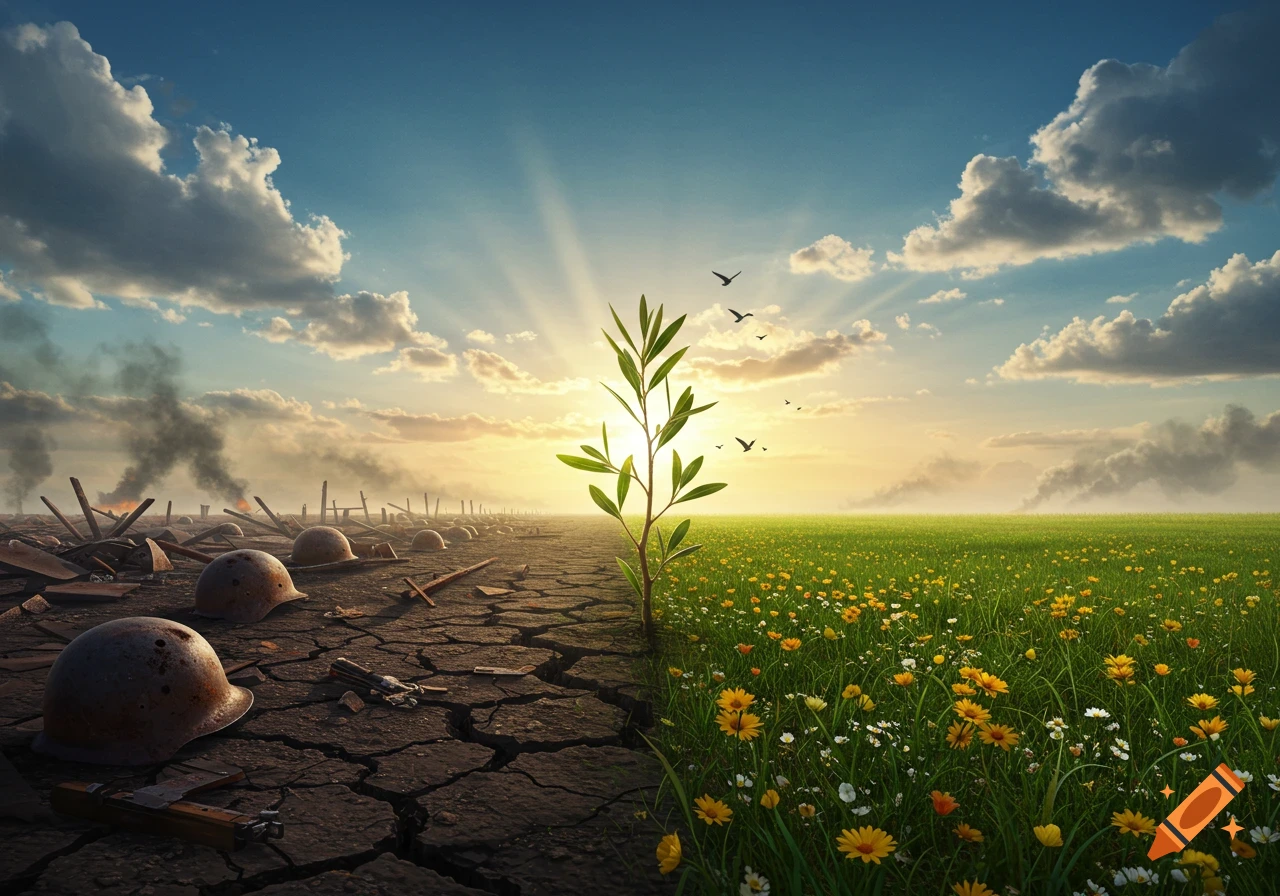
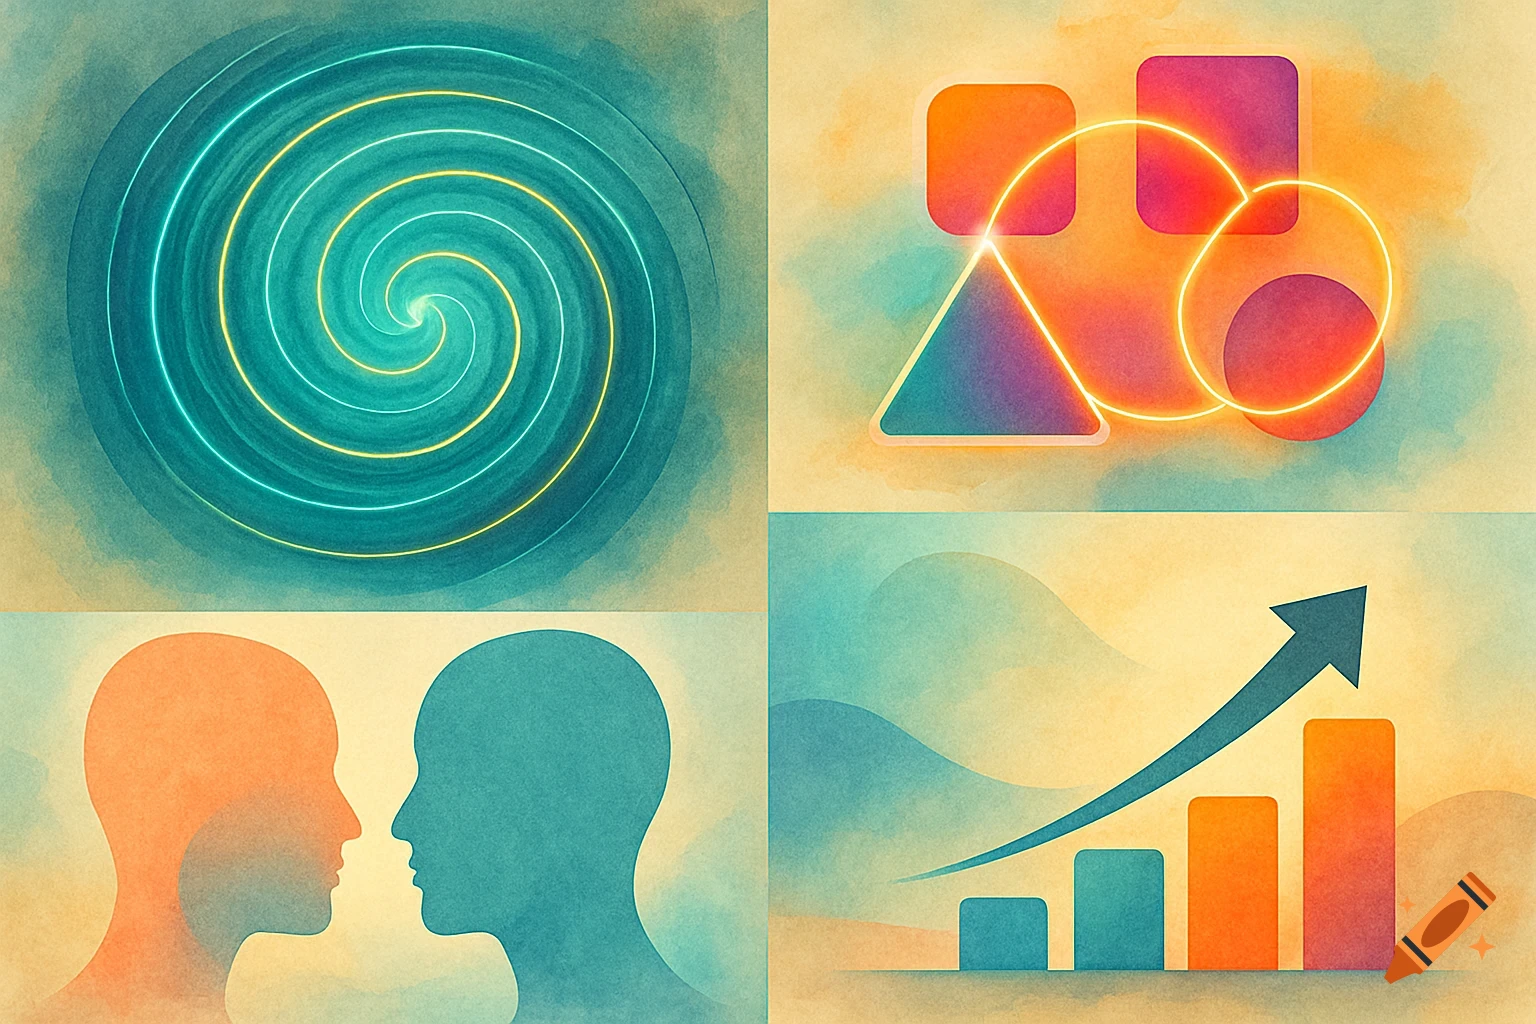
Scales of Justice + Disaster Imagery A symbolic graphic of scales balancing “resilience” on one side and “vulnerability” on the other, with a backdrop of disaster imagery (floods, earthquakes, hurricanes). This directly reflects your central argument: resilience depends on addressing vulnerability and justice. Intersectional Layers Diagram A visual with overlapping circles (gender, class, caste, race, poverty) leading into “Vulnerability → Disaster Impact.” Works well to show your essay’s focus on intersectionality. World Map with Case Study Highlights A clean world map with three markers: Nepal (earthquake), Bangladesh (floods), USA/New Orleans (Katrina). Each marker can have a small icon (🏚️ earthquake, 🌊 flood, 🌪️ hurricane). This immediately orients the reader to your three examples. Before-and-After Contrast Image Split-screen style: Left side: collapsed homes, flooded streets, or people stranded. Right side: community rebuilding together, safe housing, or resilient systems. Captures “vulnerability vs. resilience” in one glance. Sendai Framework / UNDRR Infographic A simplified graphic (already available from UNDRR) showing resilience, preparedness, and reducing vulnerability. Adds policy relevance, since you explicitly reference UNDRR. See more