Create
Remove BG
Search
Categories
Tutorial
My images
Upgrade to Pro
Help
Pro
Sign up
Retouch
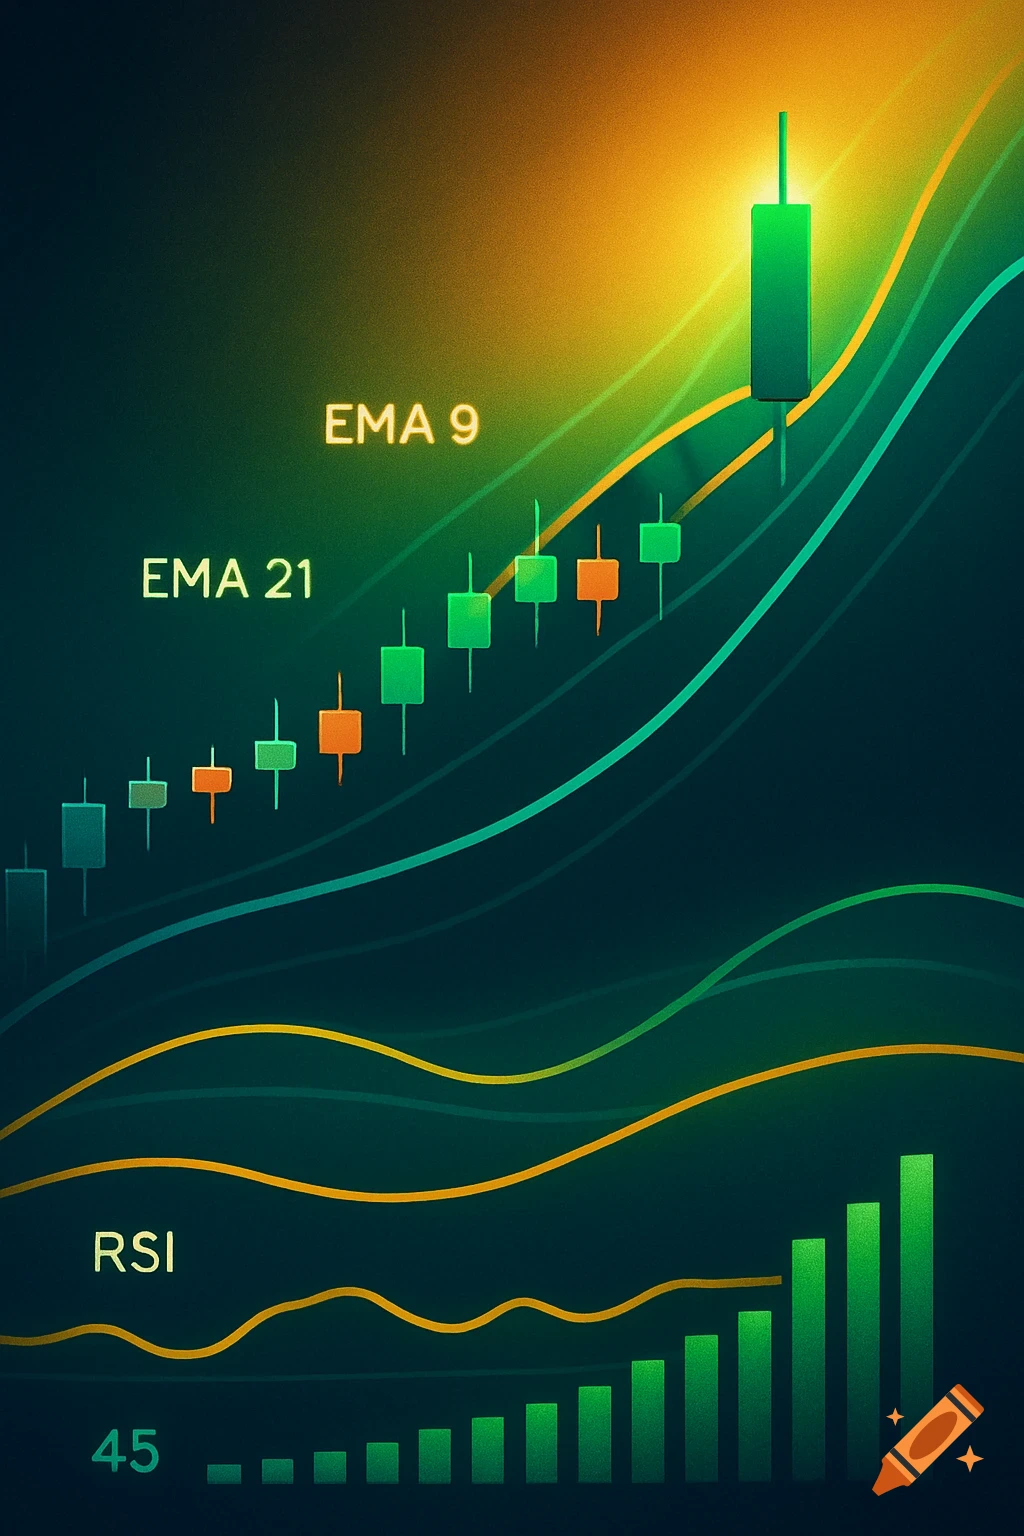
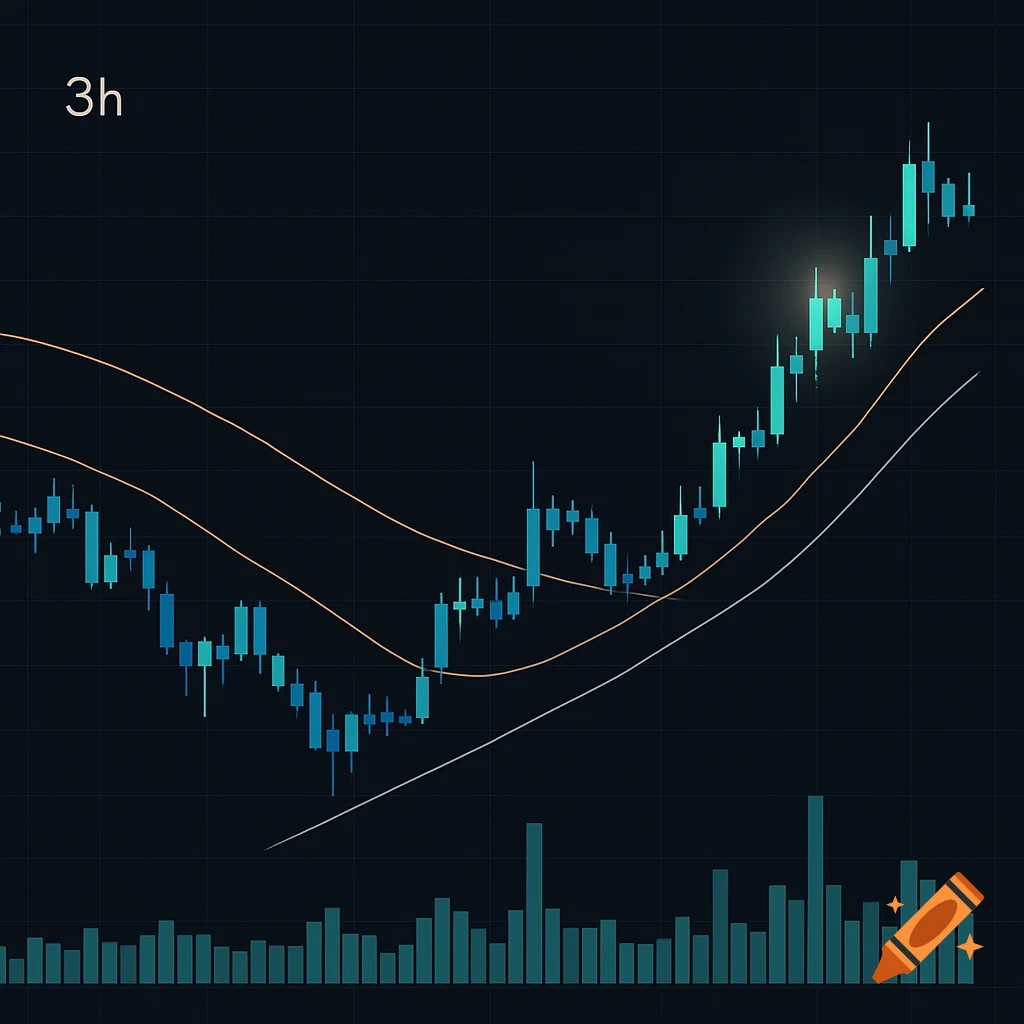
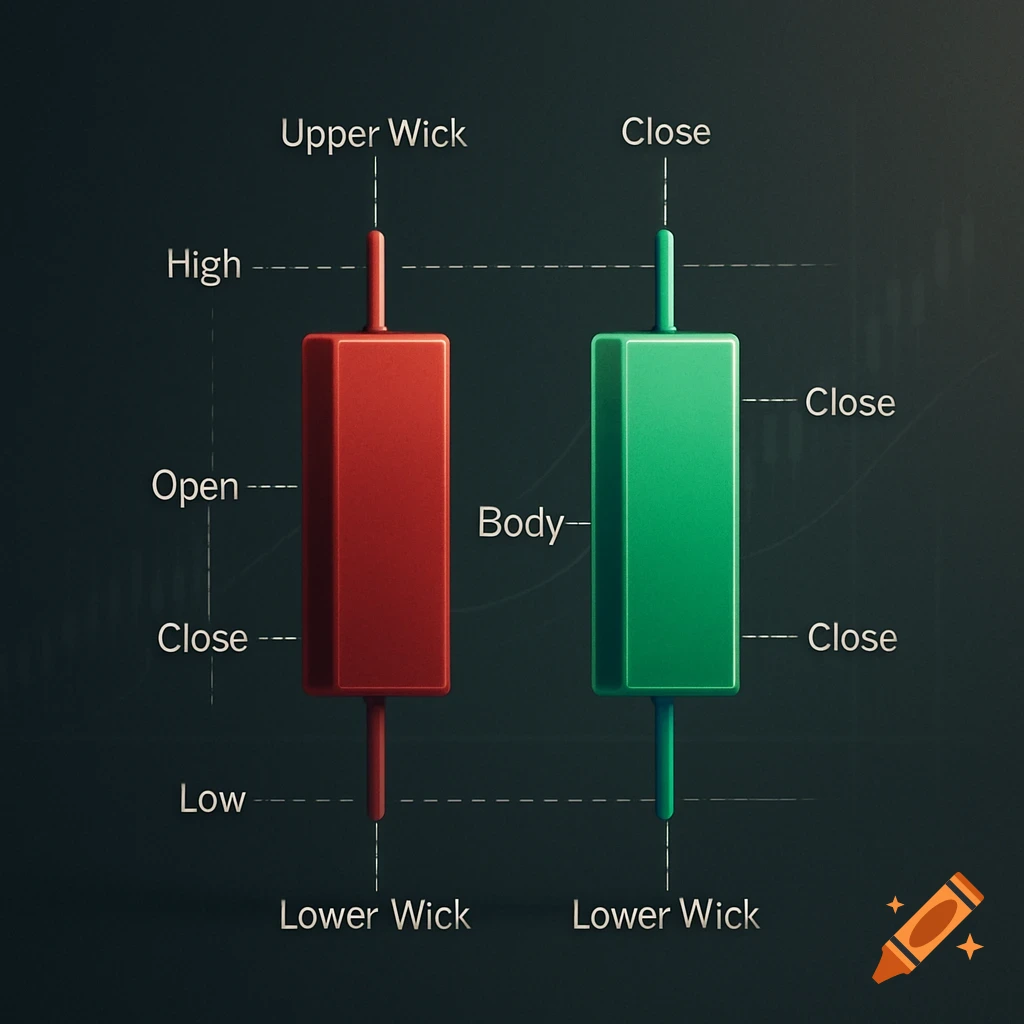
1. EMA 9 crosses ABOVE EMA 21 2. Candle closes above both EMAs 3. RSI between 45 – 60 (not overbought) 4. Volume green and increasing 5. Price pulls back to EMAs and shows a rejection wick (this is the entry) See more
Infos
Get it on a shirt