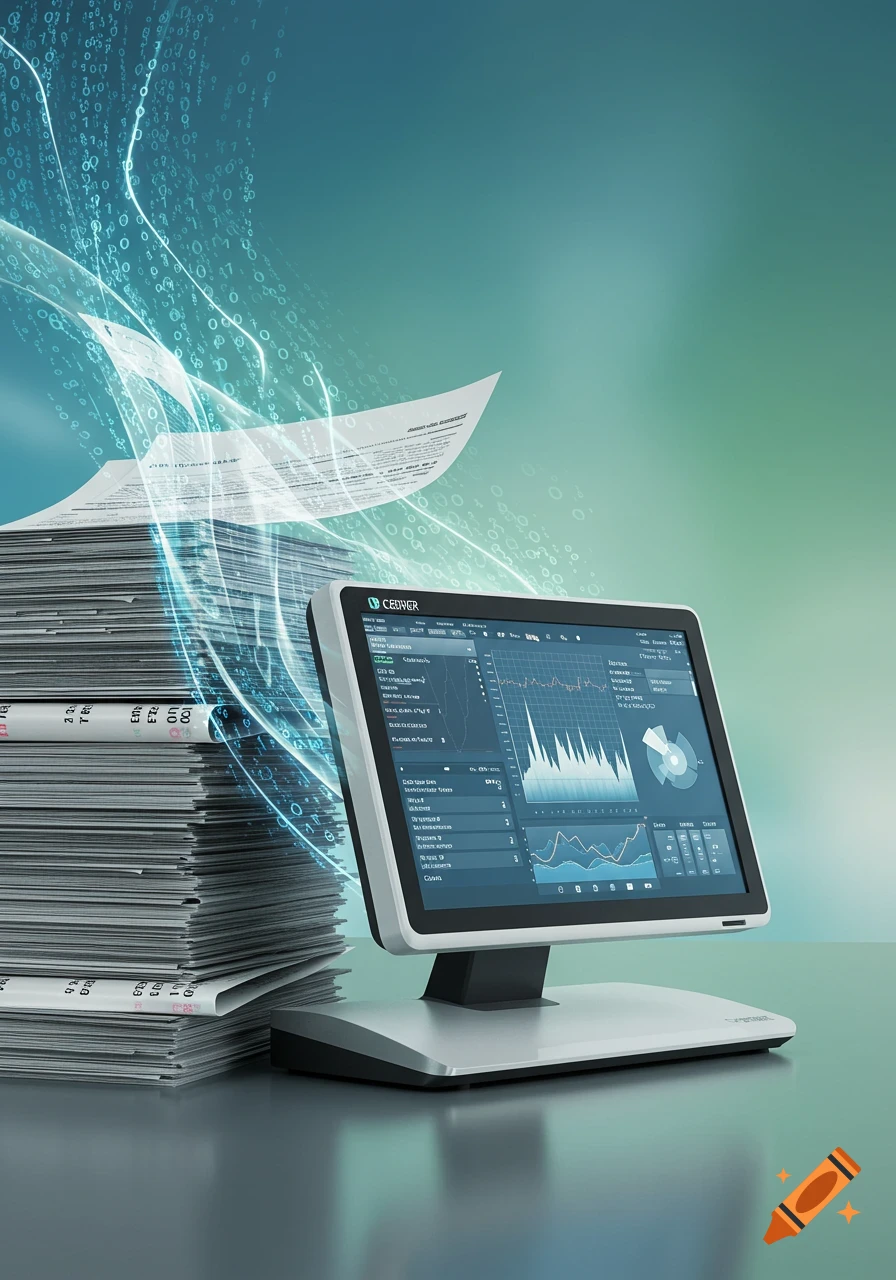
High-tech infographic showing data flowing from PDF files into a spreadsheet interface and then being uploaded to a platform.
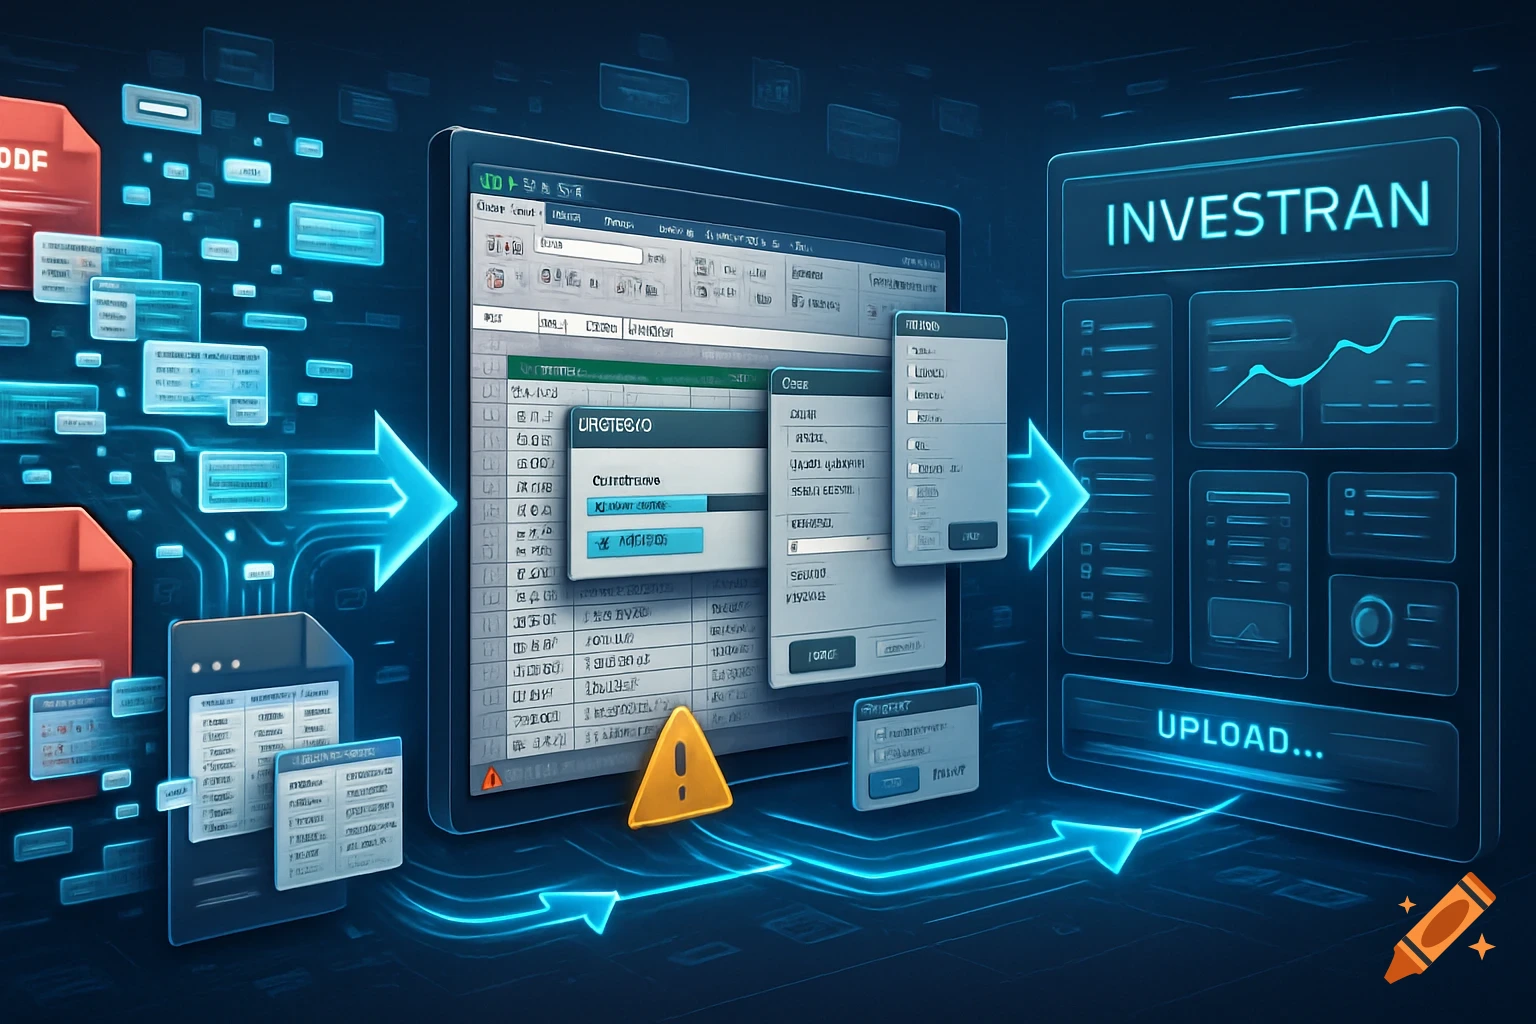
“High-tech, visually detailed infographic showing a manual data processing workflow — left side features multiple digital PDF files with data elements floating out of them — center shows a complex Excel interface with visible data cleaning, formulas, and copy-paste actions — visual clutter, multiple open windows, progress bars, and warning icons emphasize manual effort — glowing arrows and digital trails show flow of data — final step on the right shows data being uploaded into a sleek enterprise platform labeled ‘Investran’ with futuristic UI panels — tech-inspired color palette with blues, grays, and neon accents — modern, 3D-rendered style with depth and lighting, highly professional, high resolution for enterprise presentation use, no AI elements” See more