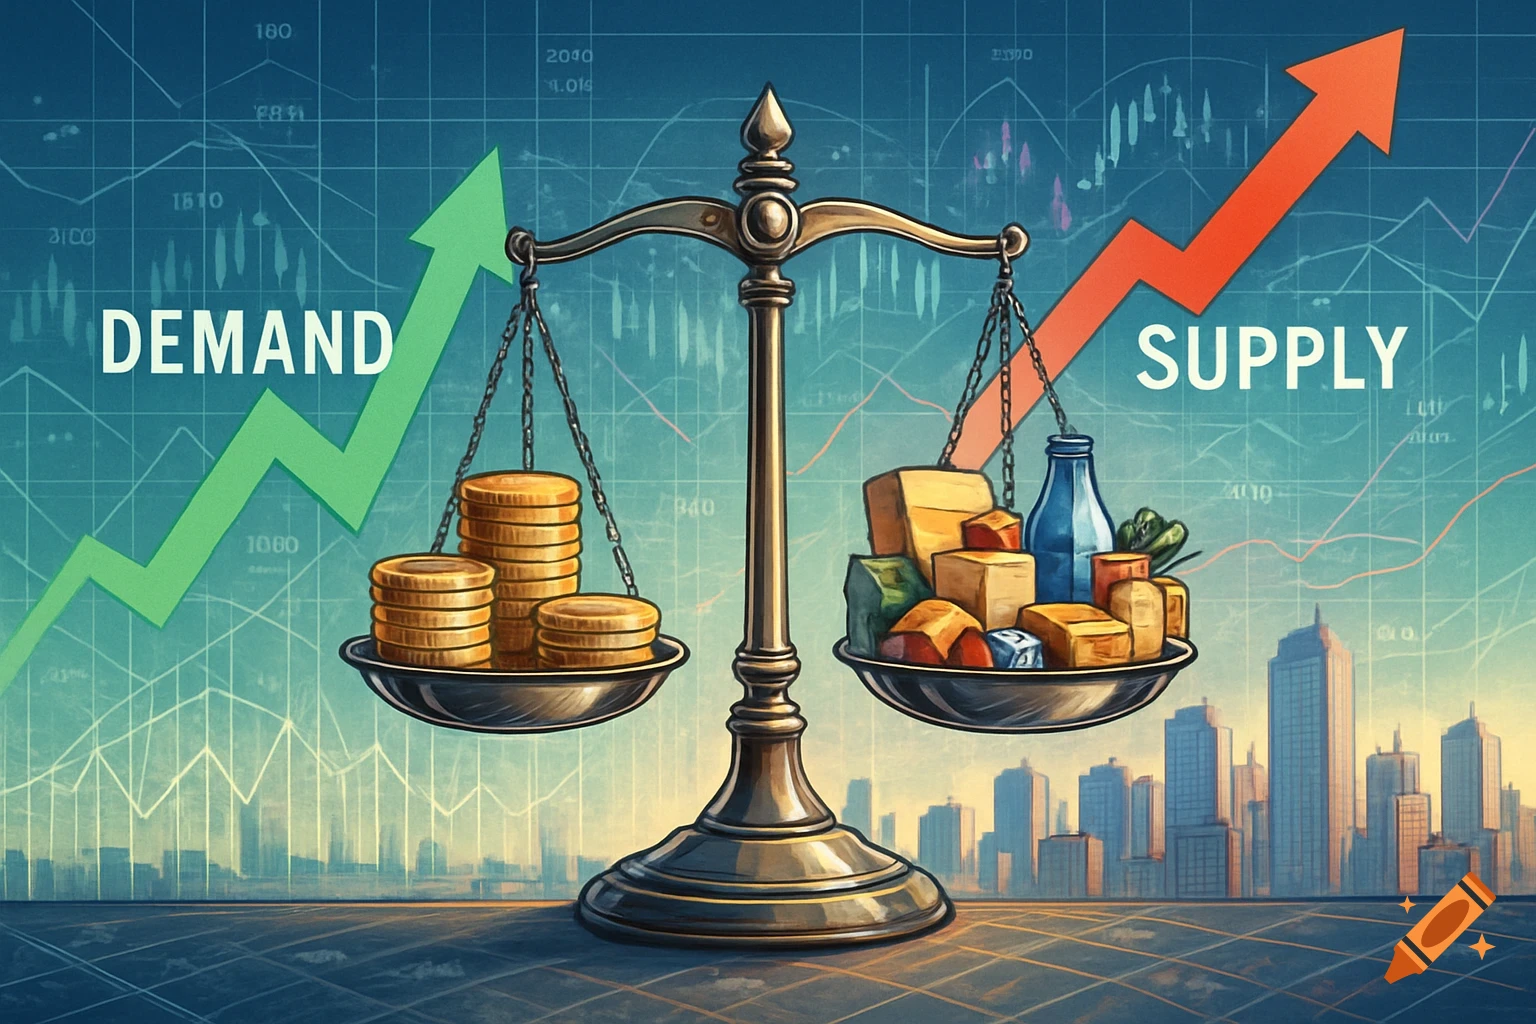
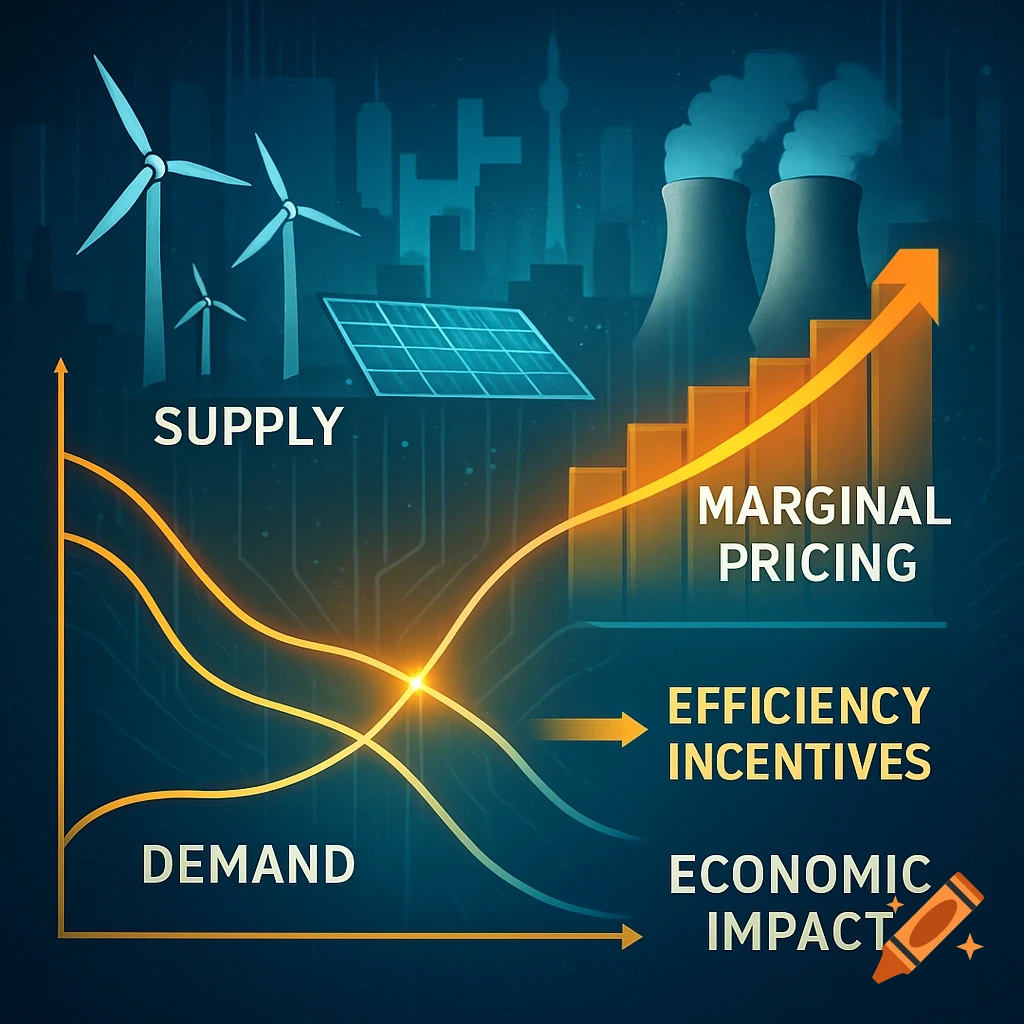
An economics graph showing supply and demand curves next to an oil pump, illustrating the effect of reduced oil drilling in a painterly style.
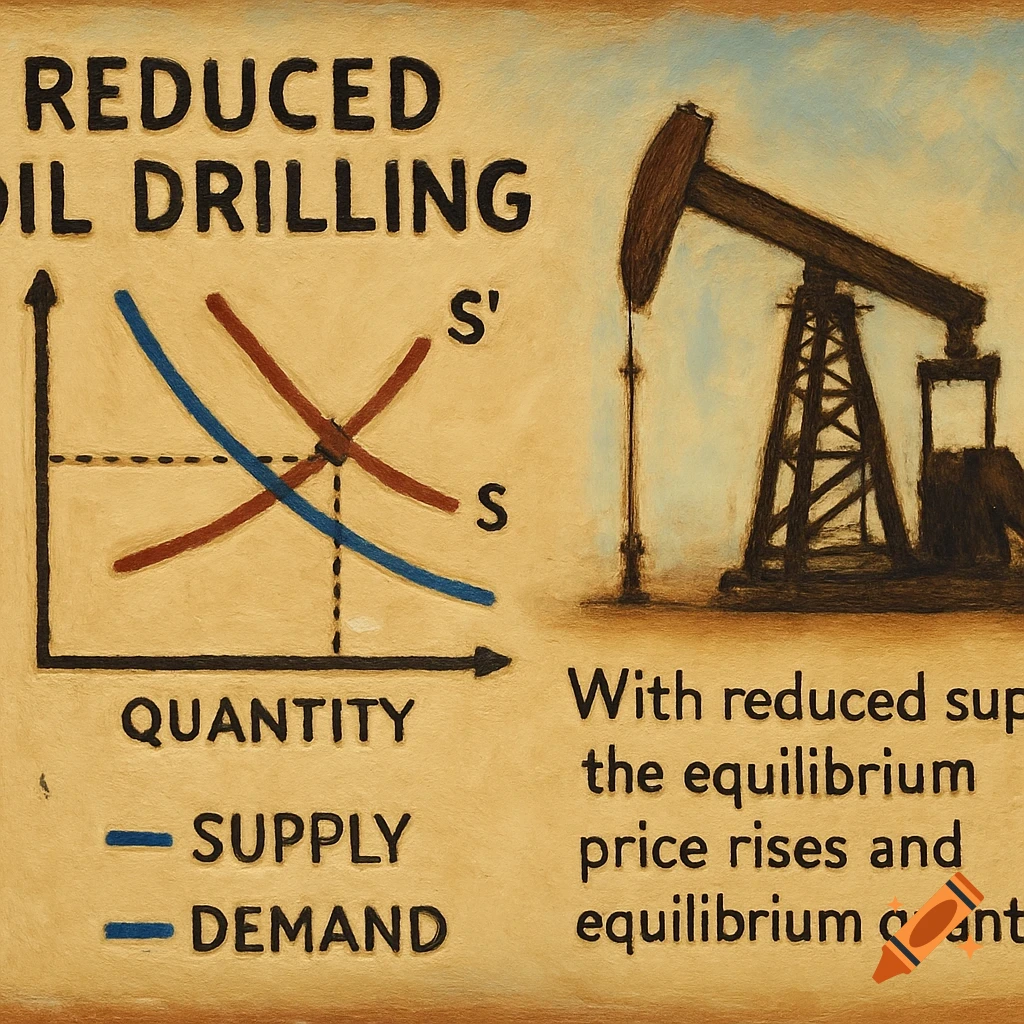
✅ Example #2: Reduced Oil Drilling What’s happening? The government restricts oil drilling, which reduces the supply of oil. This causes the supply curve to shift left (a decrease in supply). Graph features: Supply curve shifts left Demand remains unchanged Axes labeled: Price and Quantity Explanation: With reduced supply, the equilibrium price rises and equilibrium quantity falls. See more