Infographic showing charts on how scanning frequency boosts soccer performance.
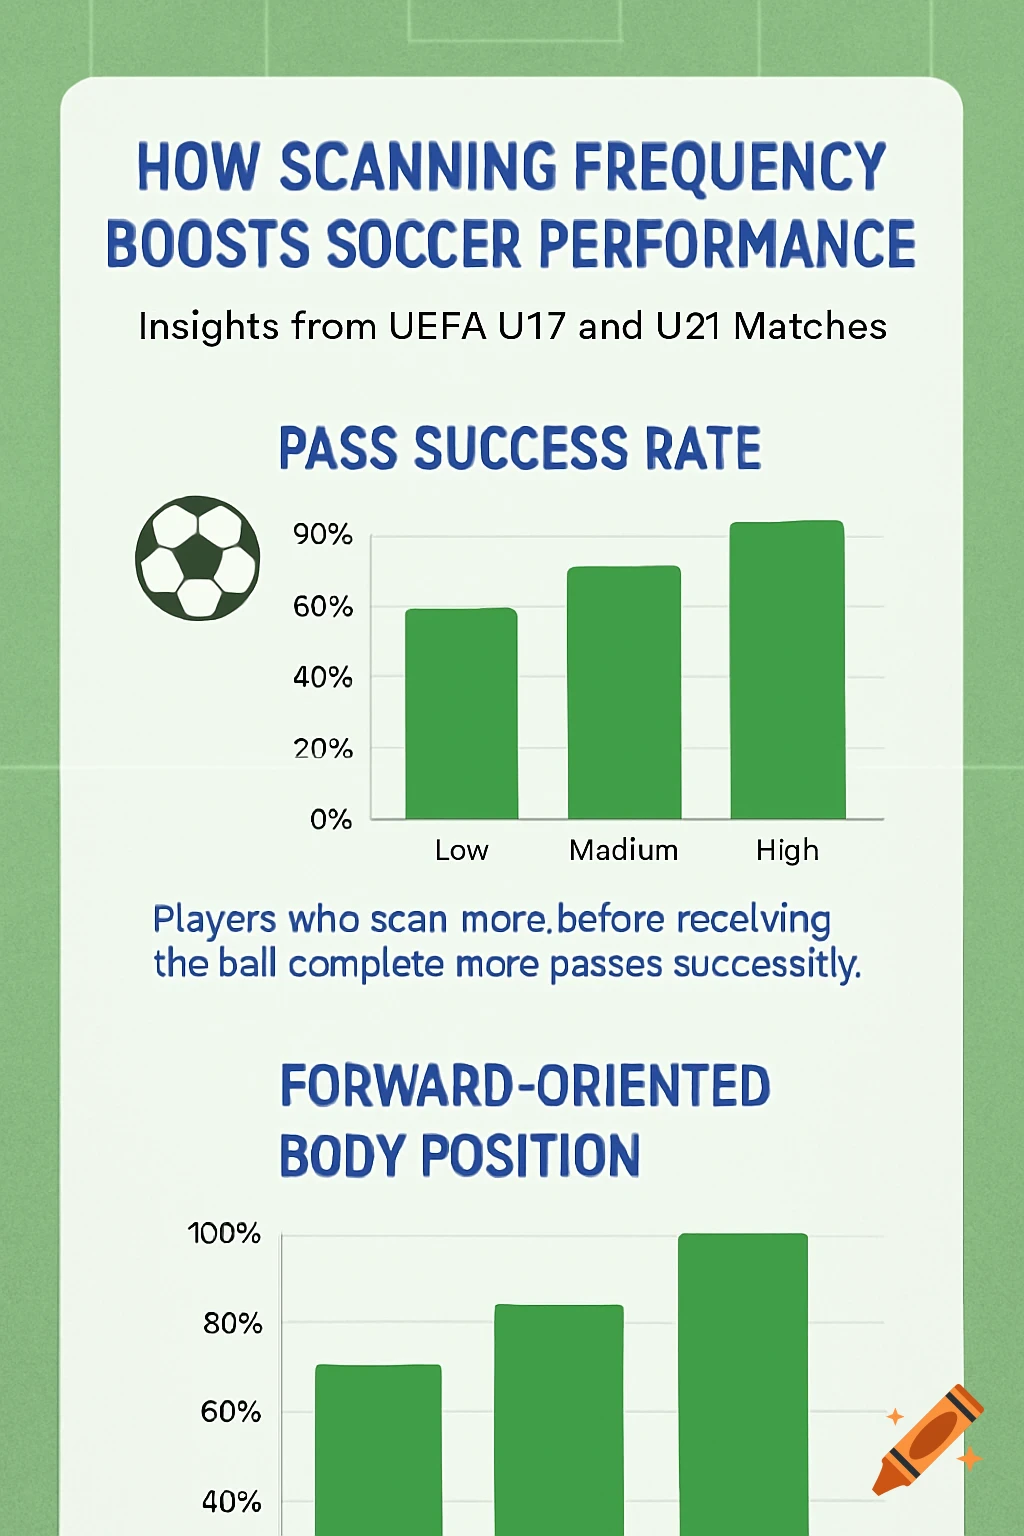
Detailed Infographic Specification: Scanning Frequency and Soccer Performance Title: How Scanning Frequency Boosts Soccer Performance Dimensions: 800px wide x 1200px tall (portrait orientation for easy viewing). Background: A light green soccer field texture (subtle, not distracting). White overlay with 80% opacity in the center for text and chart readability. Color Scheme: Primary: Green (#4CAF50 for bars, soccer field vibe). Secondary: Blue (#2196F3 for accents, text). Neutral: White (#FFFFFF for background), Black (#000000 for text). Fonts: Title: Bold sans-serif (e.g., Montserrat Bold, 36pt). Labels/Annotations: Clean sans-serif (e.g., Roboto Regular, 14pt). Layout: Header (Top 15%): Title: “How Scanning Frequency Boosts Soccer Performance” (centered, blue text, bold). Subtitle: “Insights from UEFA U17 and U21 Matches” (smaller, black text, italicized). Section 1: Pass Success Rate (25%): Bar Chart: X-axis: Scanning Frequency (Low, Medium, High). Y-axis: Pass Success Rate (0% to 100%, increments of 20%). Bars: Green, labeled with values (Low: 70%, Medium: 80%, High: 90%). Example values are illustrative, showing a positive correlation. Annotation: “Players who scan more before receiving the ball complete more passes successfully.” (blue text, below chart). Icon: A soccer ball (left of chart, 50x50px). Section 2: Forward-Oriented Body Position (25%): Bar Chart: X-axis: Scanning Frequency (Low, Medium, High). Y-axis: % Forward-Oriented Body Position (0% to 100%, increments See more