An illustration of a weather map with black and purple contour lines, blue and purple frontal symbols, and text labels for 50 degrees, 60 degrees, and 100.2 kPa.
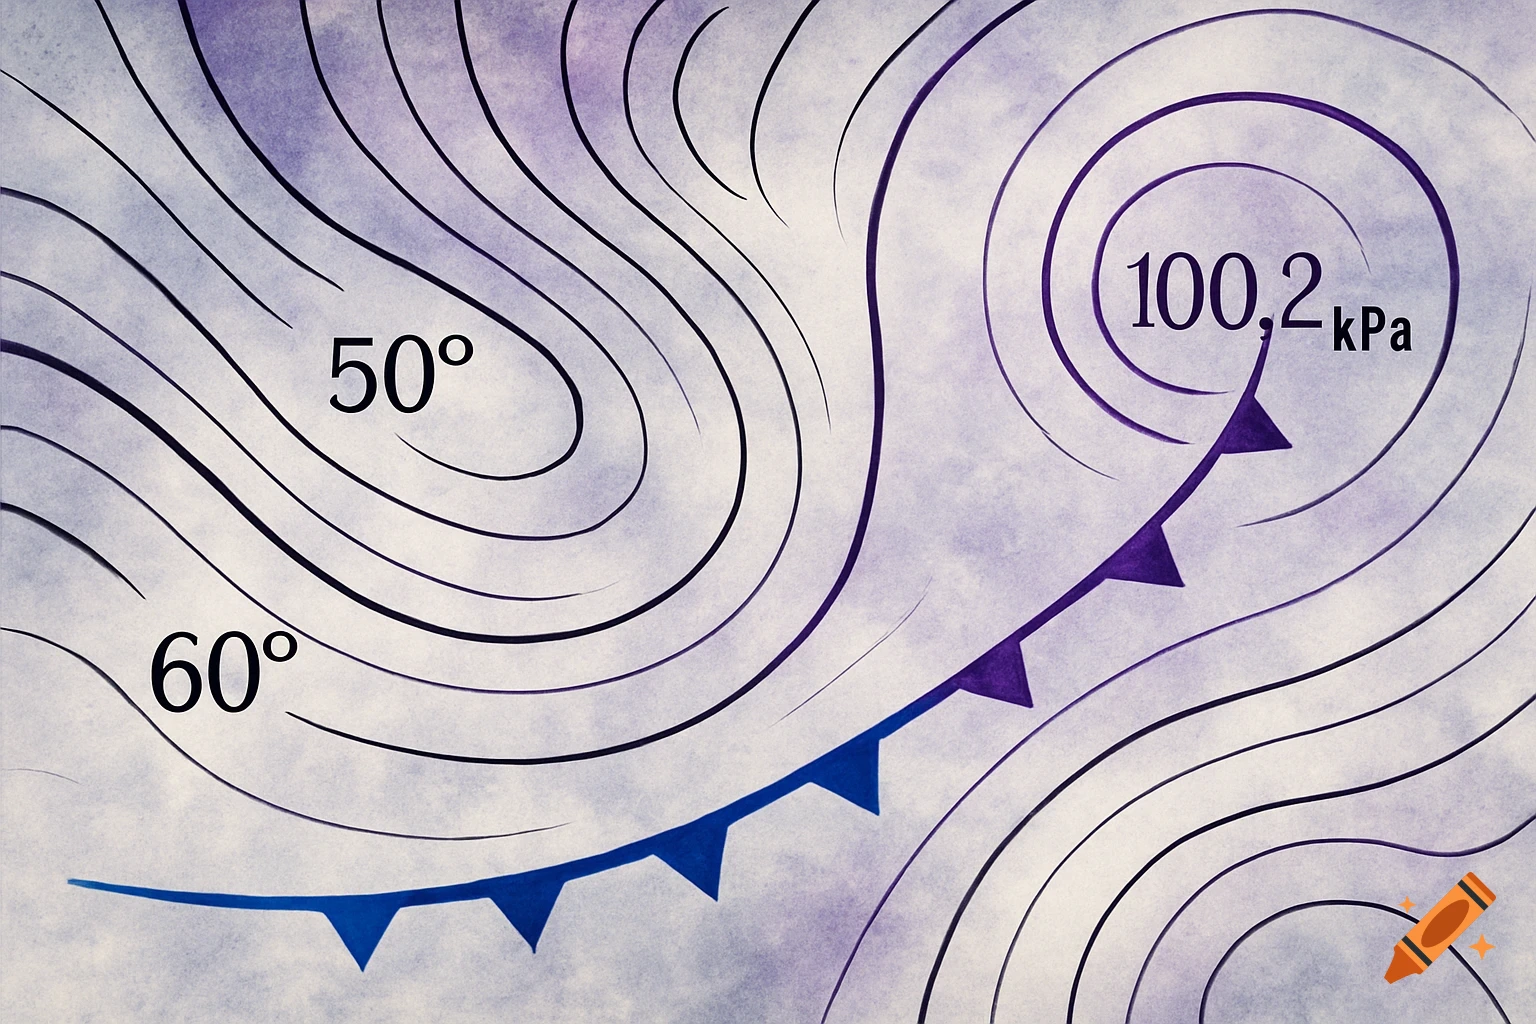
from PIL import Image, ImageDraw import matplotlib.pyplot as plt # Load your image (replace with your file path) image_path = "IMG_1634.jpeg" base_image = Image.open(image_path).convert("RGBA") # Create a drawing context draw = ImageDraw.Draw(base_image) # Draw sample isotherms (black lines) draw.line([(100, 200), (300, 250), (500, 300)], fill="black", width=2) # 50°F draw.line([(100, 300), (300, 350), (500, 400)], fill="black", width=2) # 60°F draw.text((510, 290), "50°F", fill="black") draw.text((510, 390), "60°F", fill="black") # Draw sample isobar (purple line) draw.line([(150, 220), (320, 270), (480, 320)], fill="purple", width=2) draw.text((490, 310), "100.2 kPa", fill="purple") # Draw cold front (blue line with triangles) cold_front = [(250, 250), (300, 300), (350, 350)] draw.line(cold_front, fill="blue", width=3) for x, y in cold_front: draw.polygon([(x, y), (x+10, y-10), (x+10, y+10)], fill="blue") # Display the result base_image.show() See more