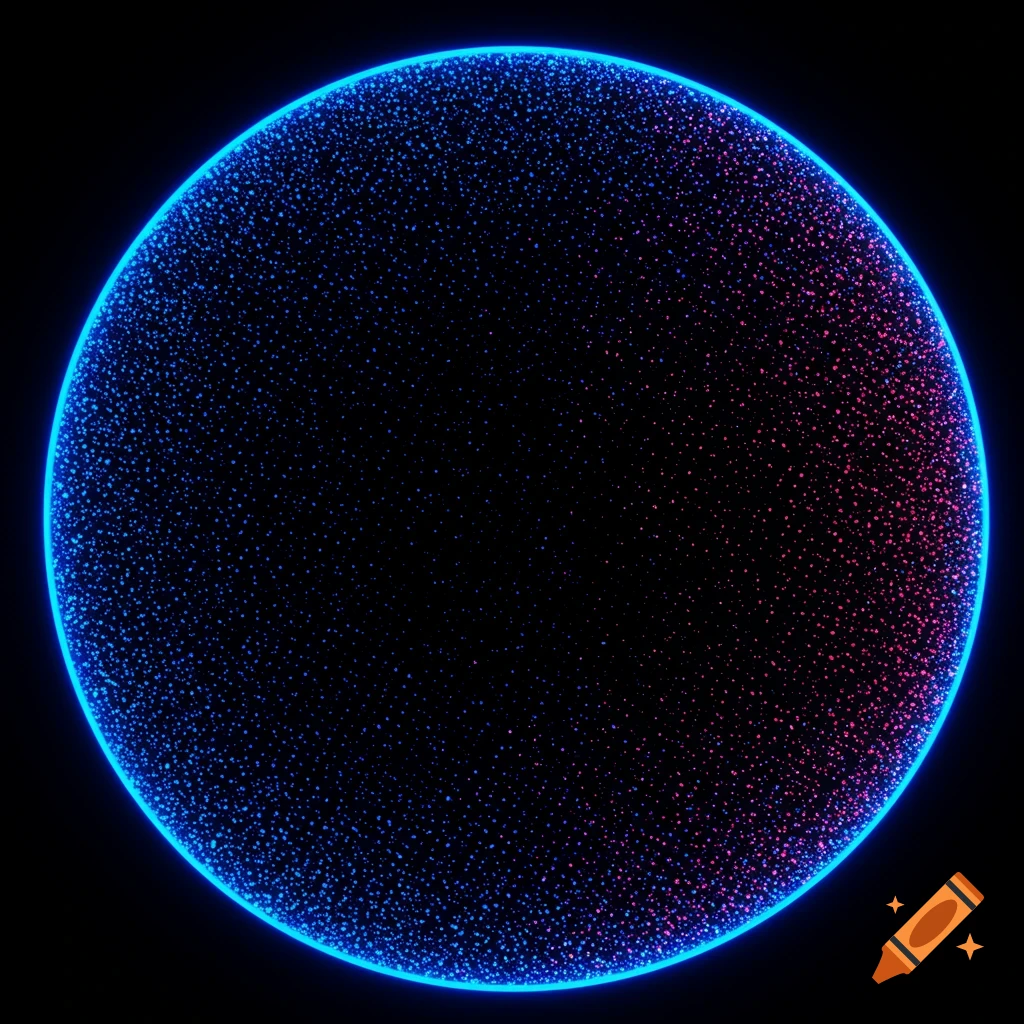
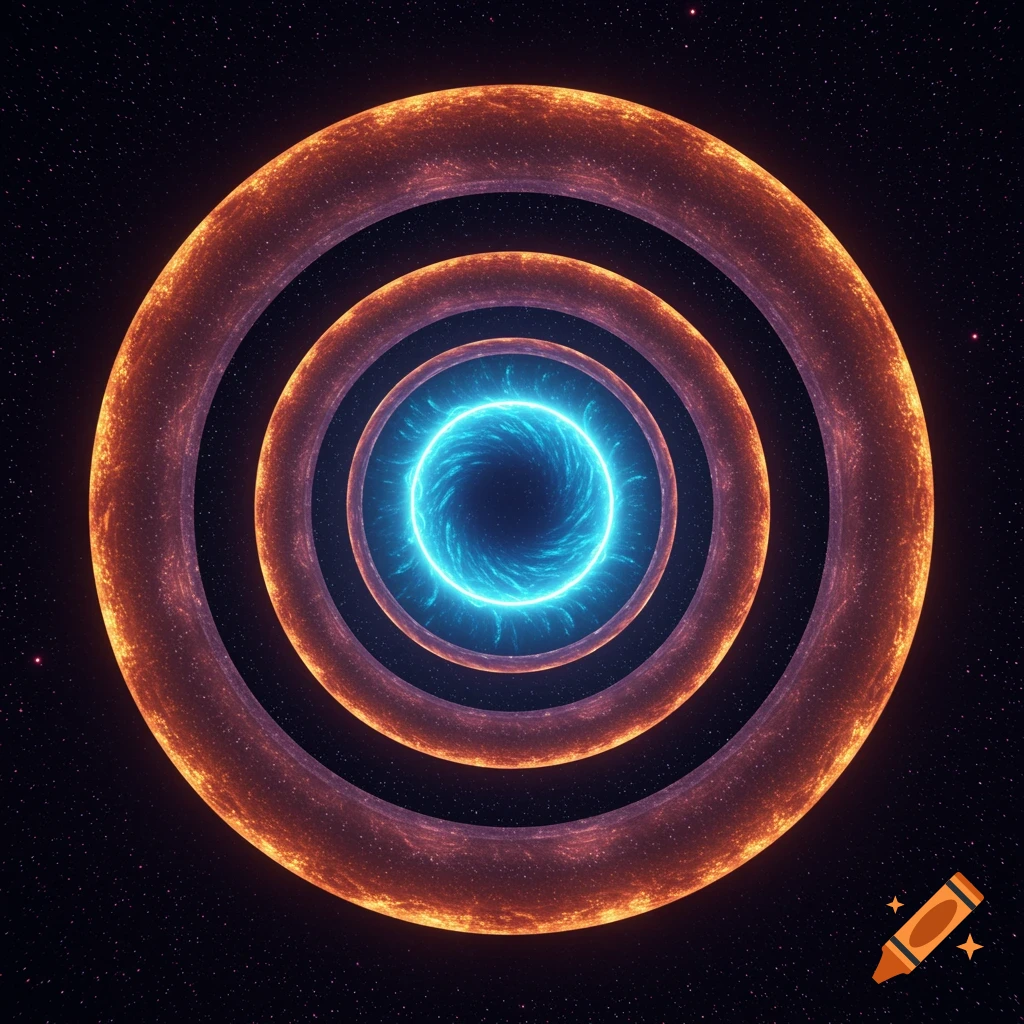
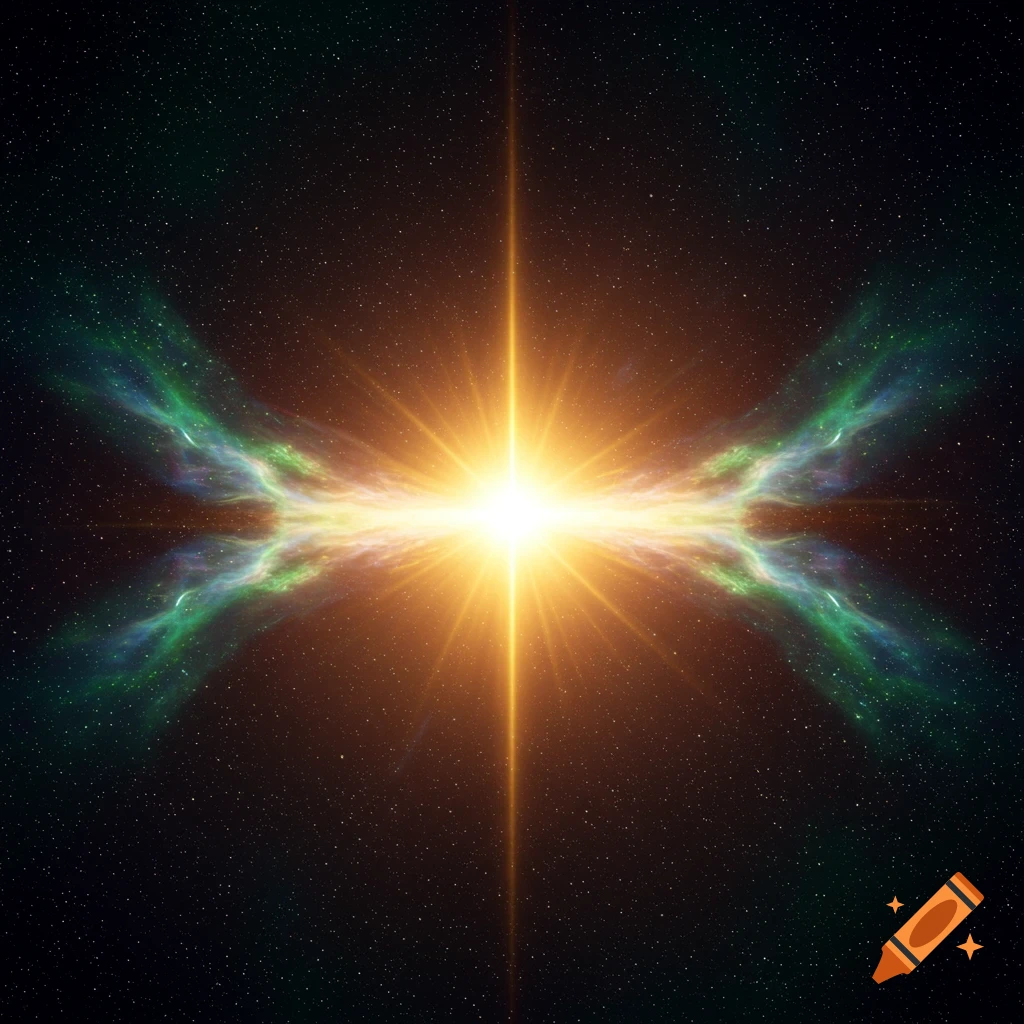
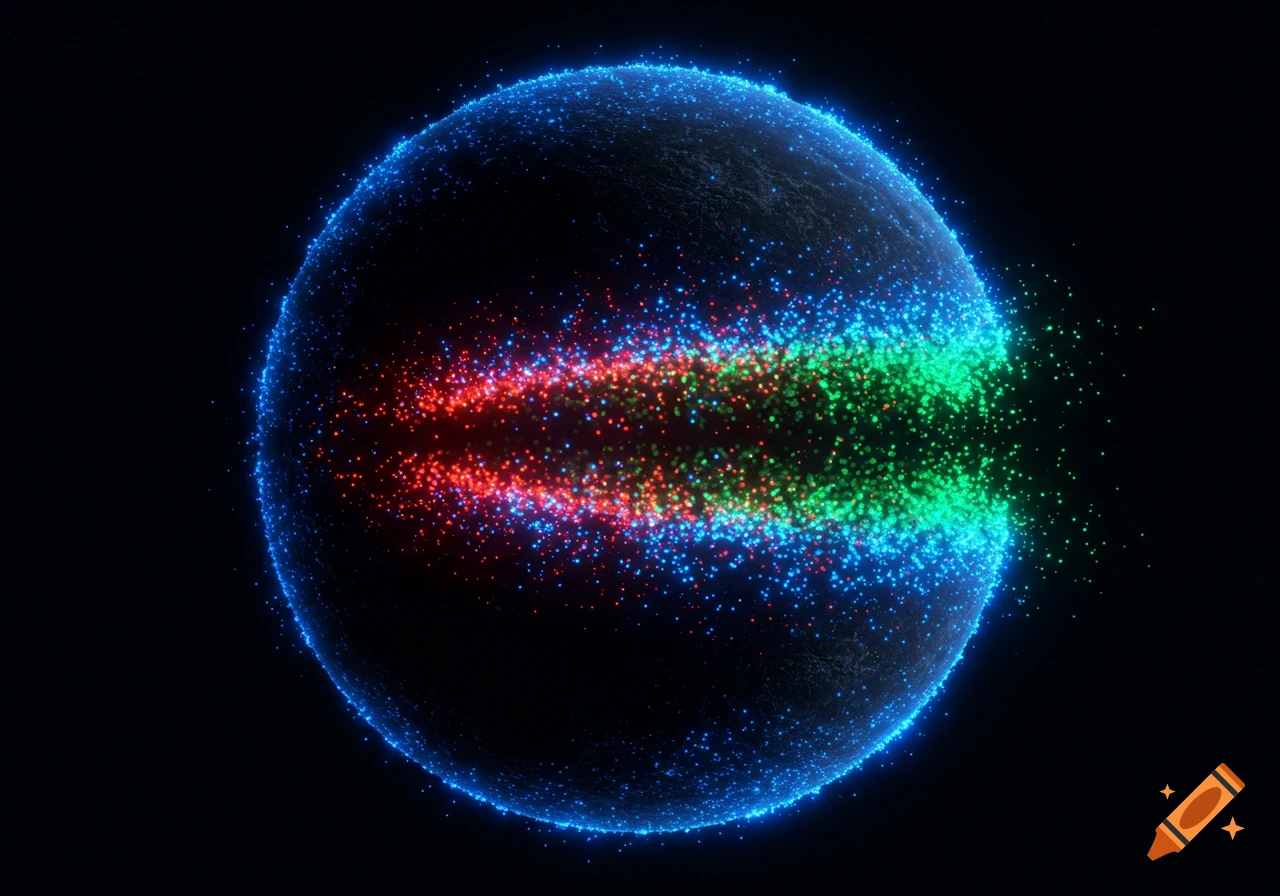
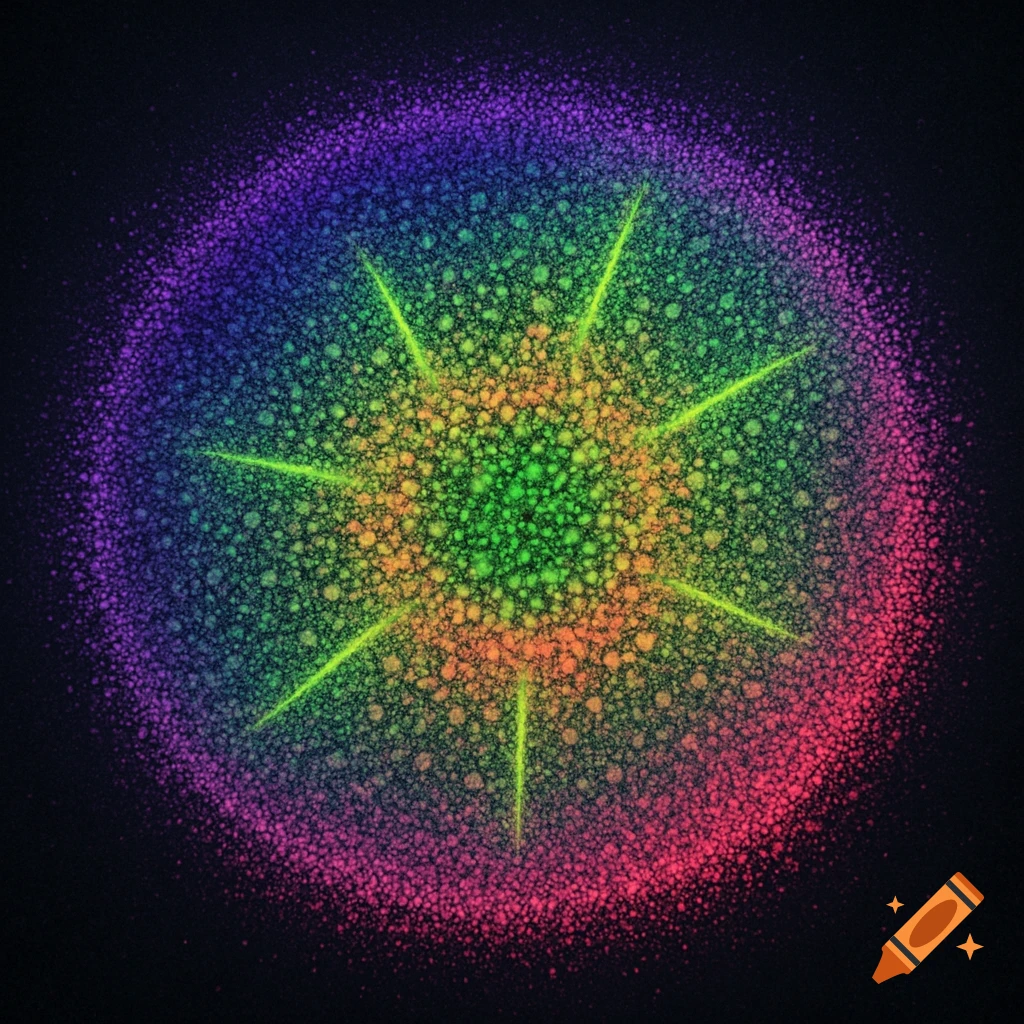
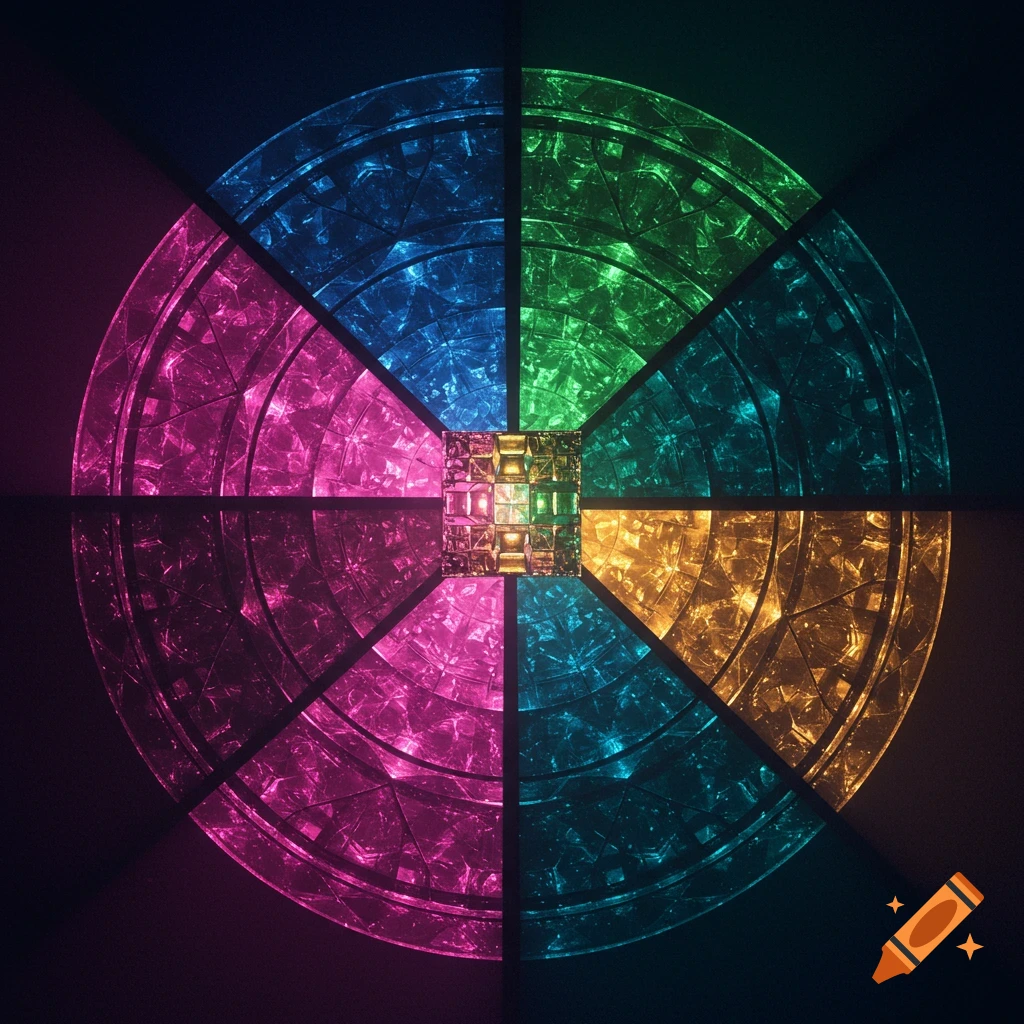
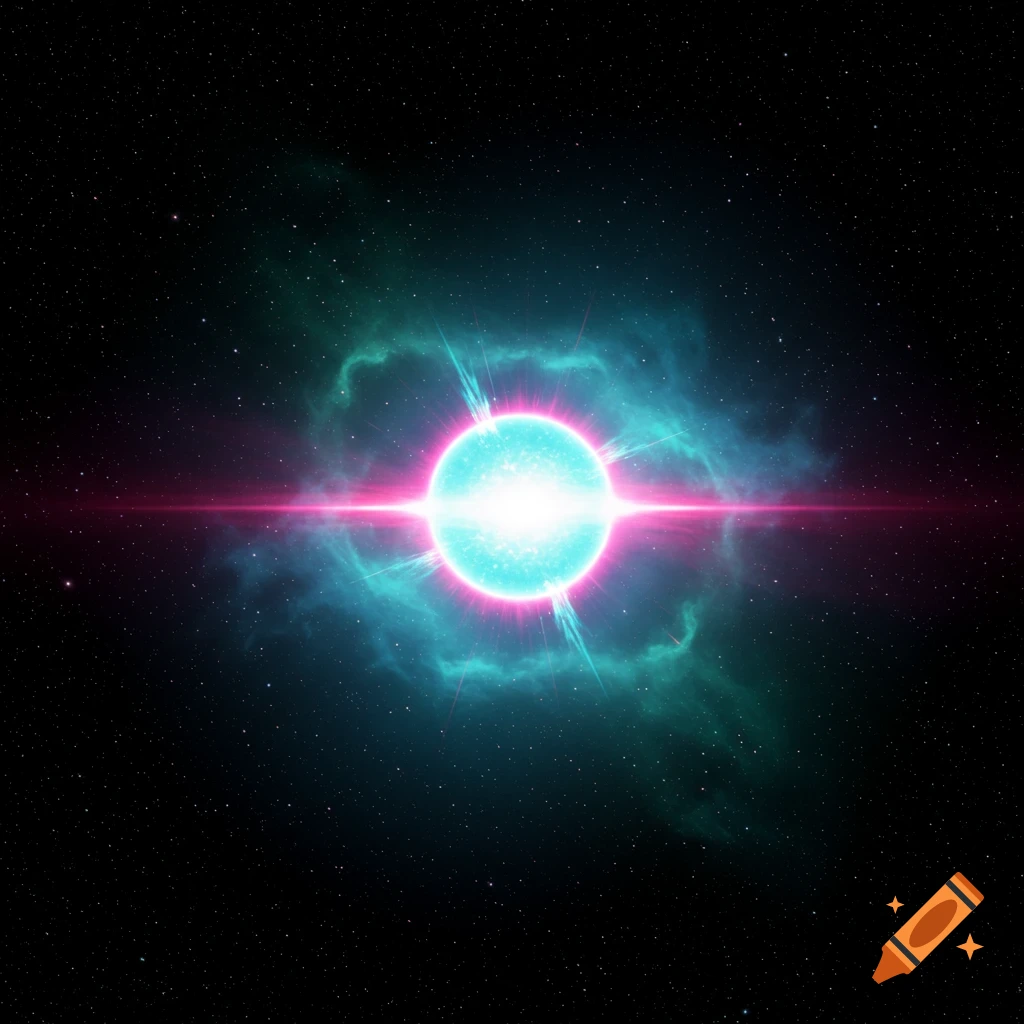
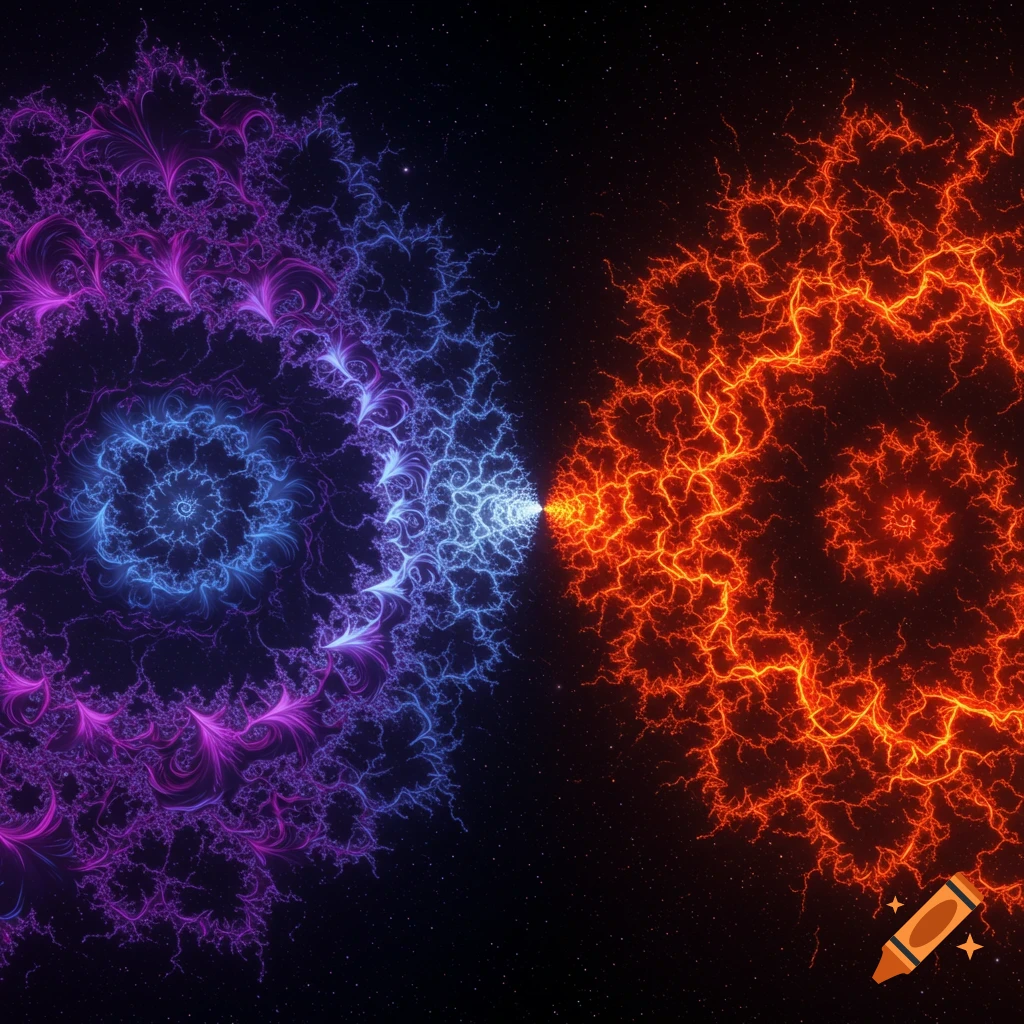
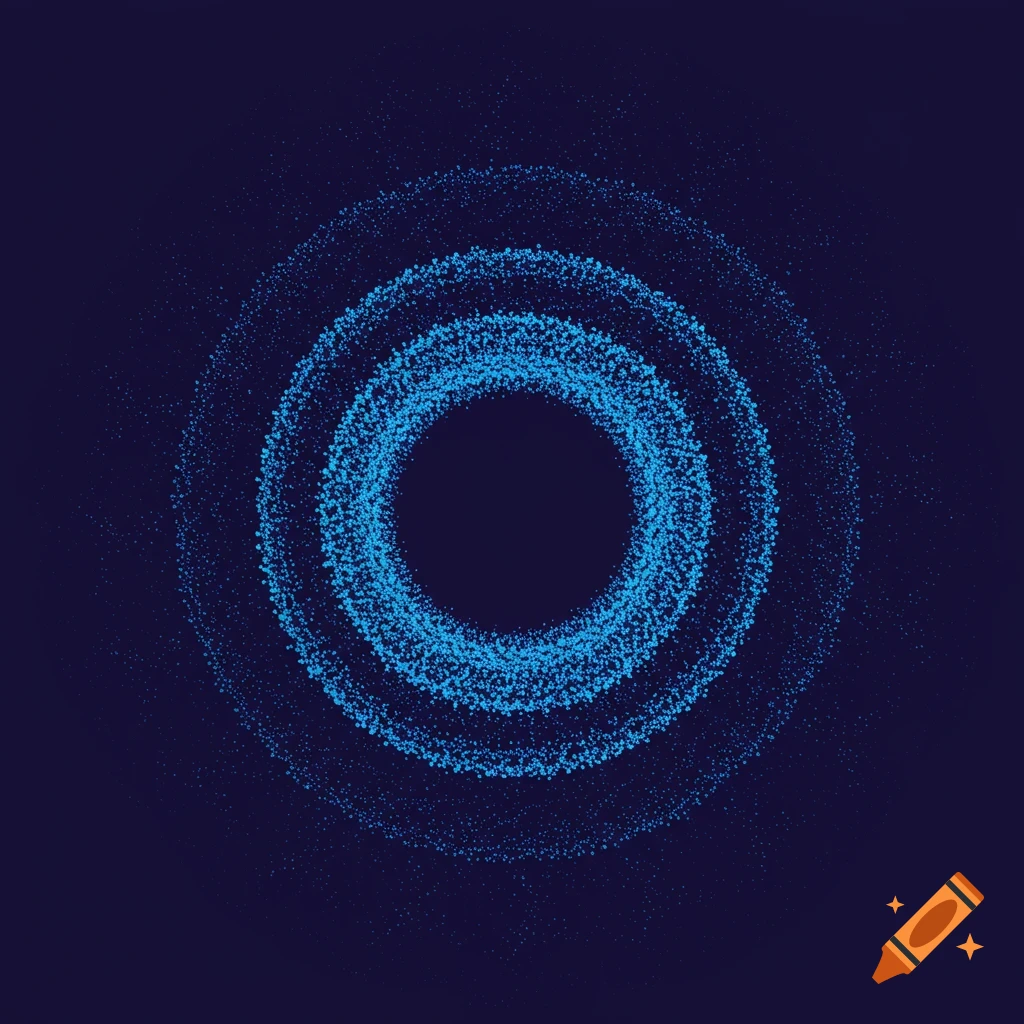
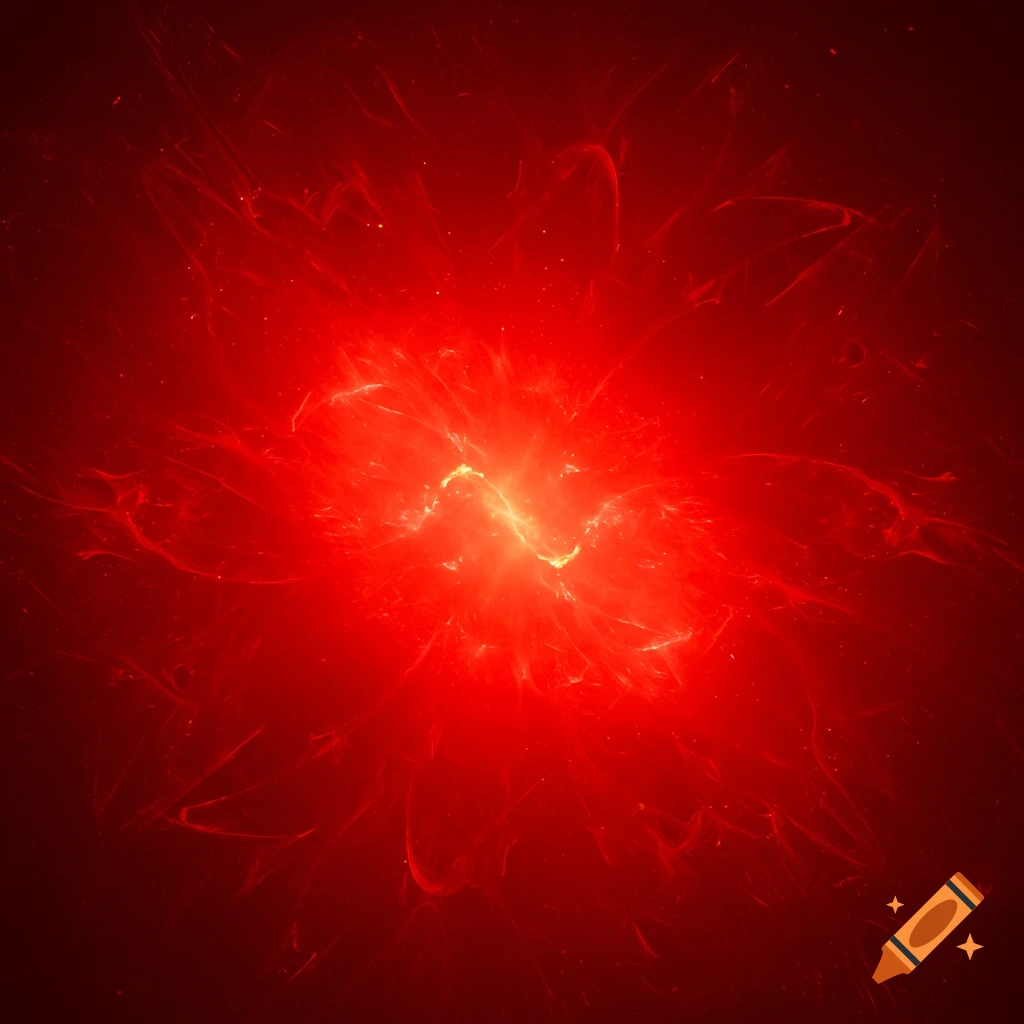
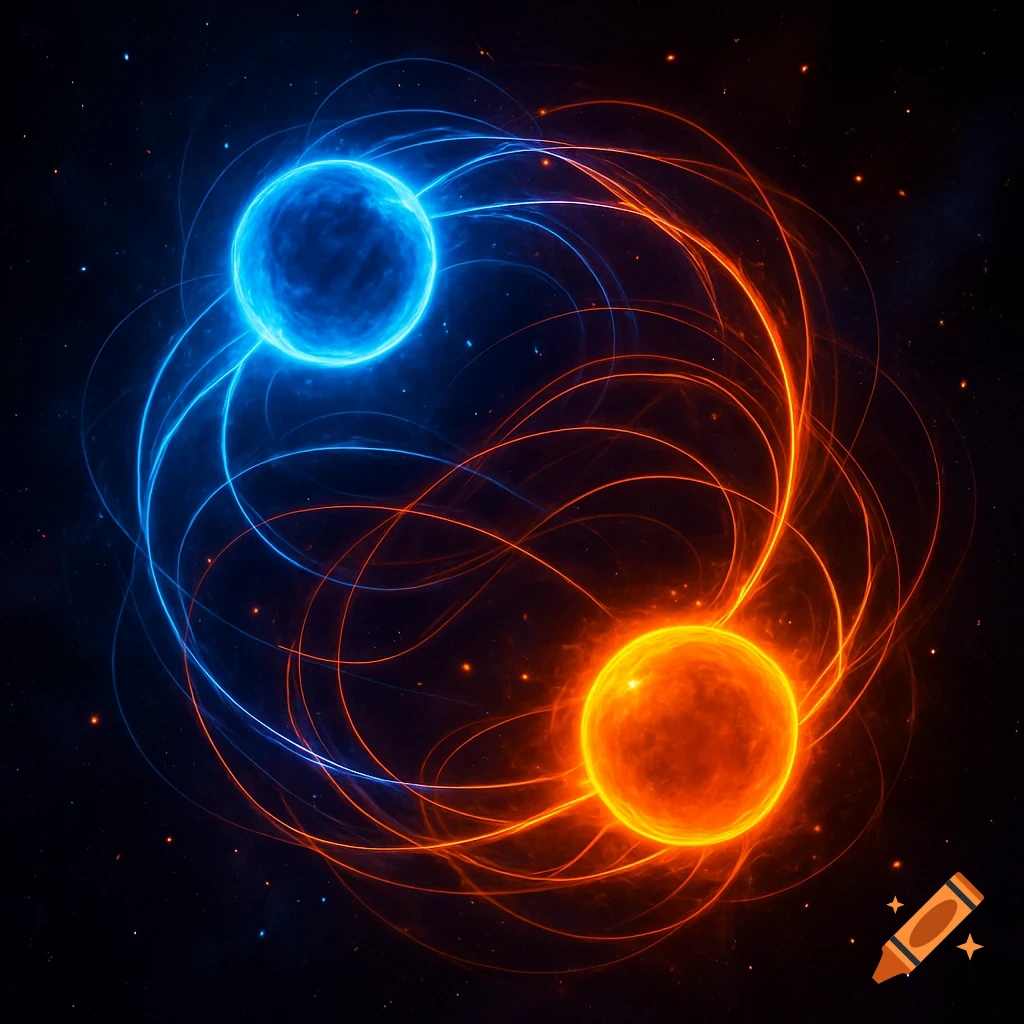
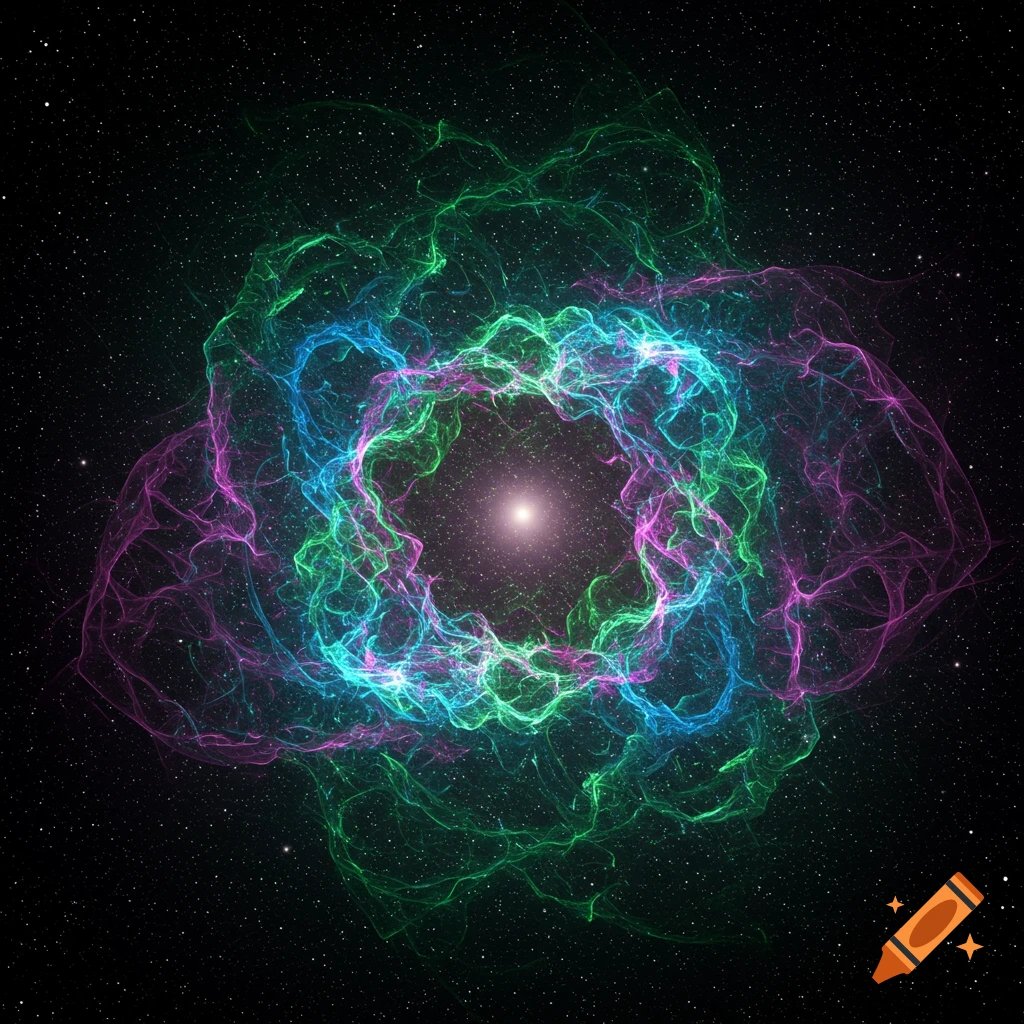
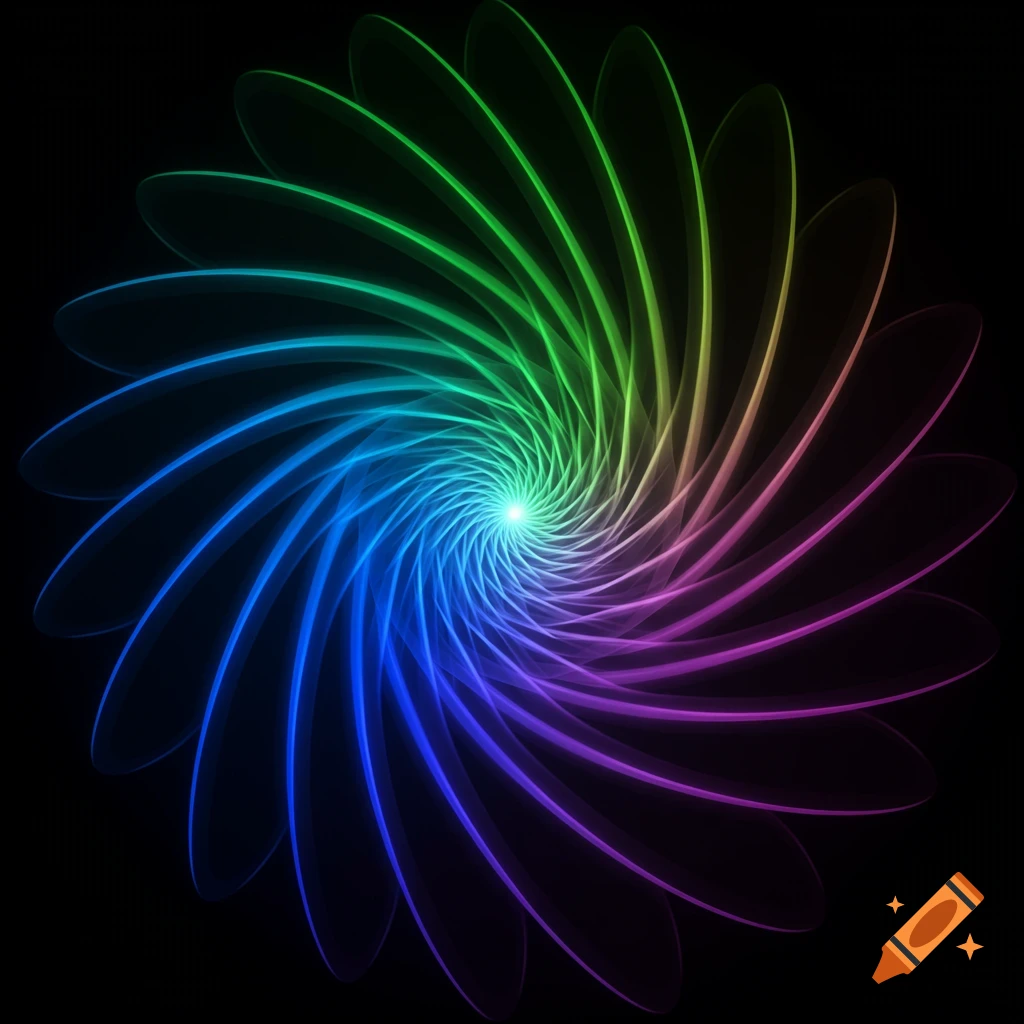
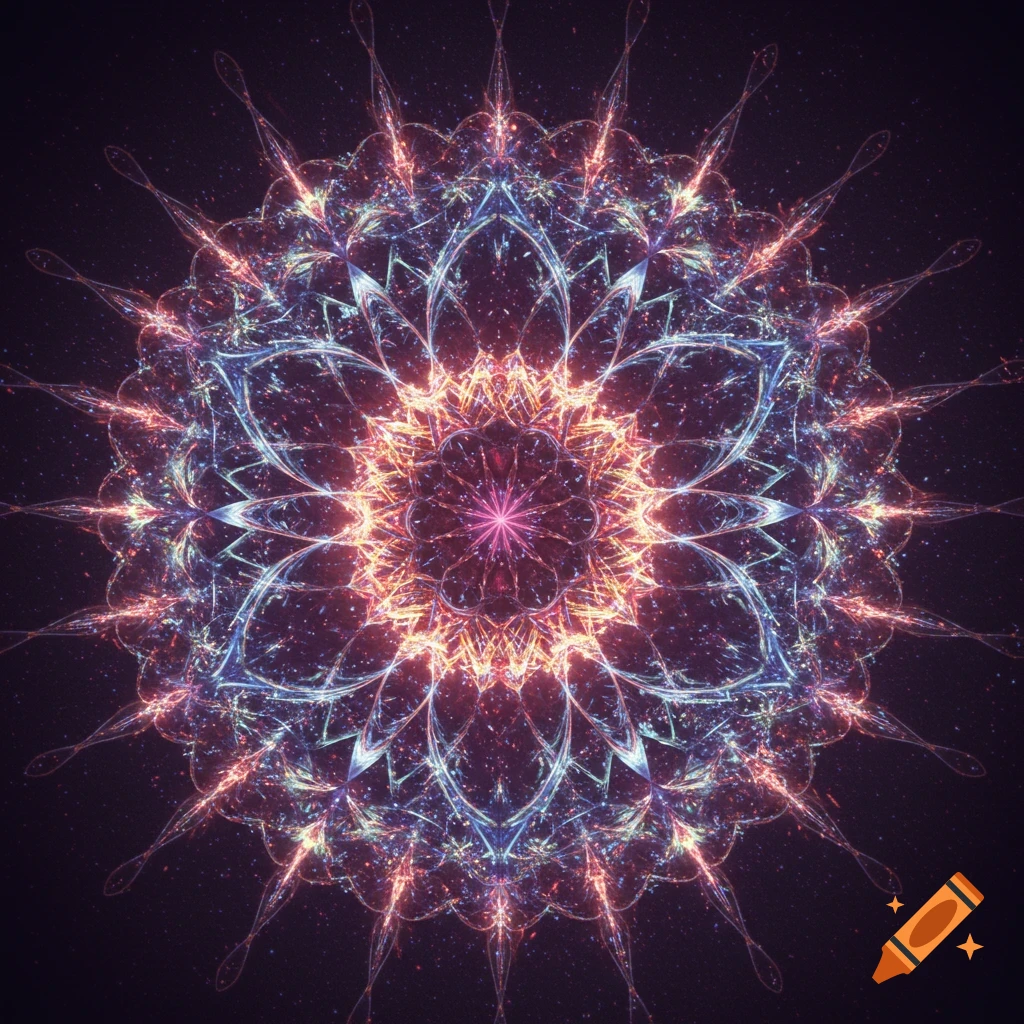
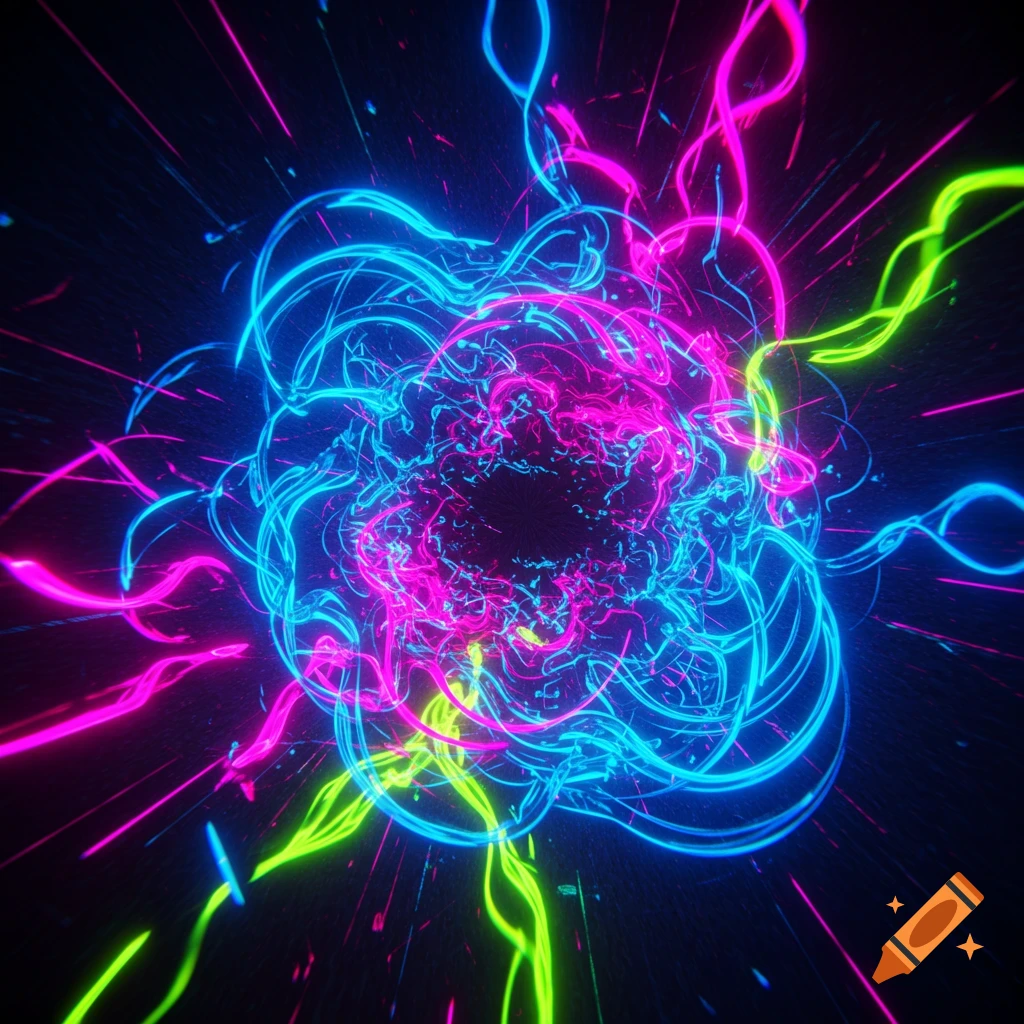
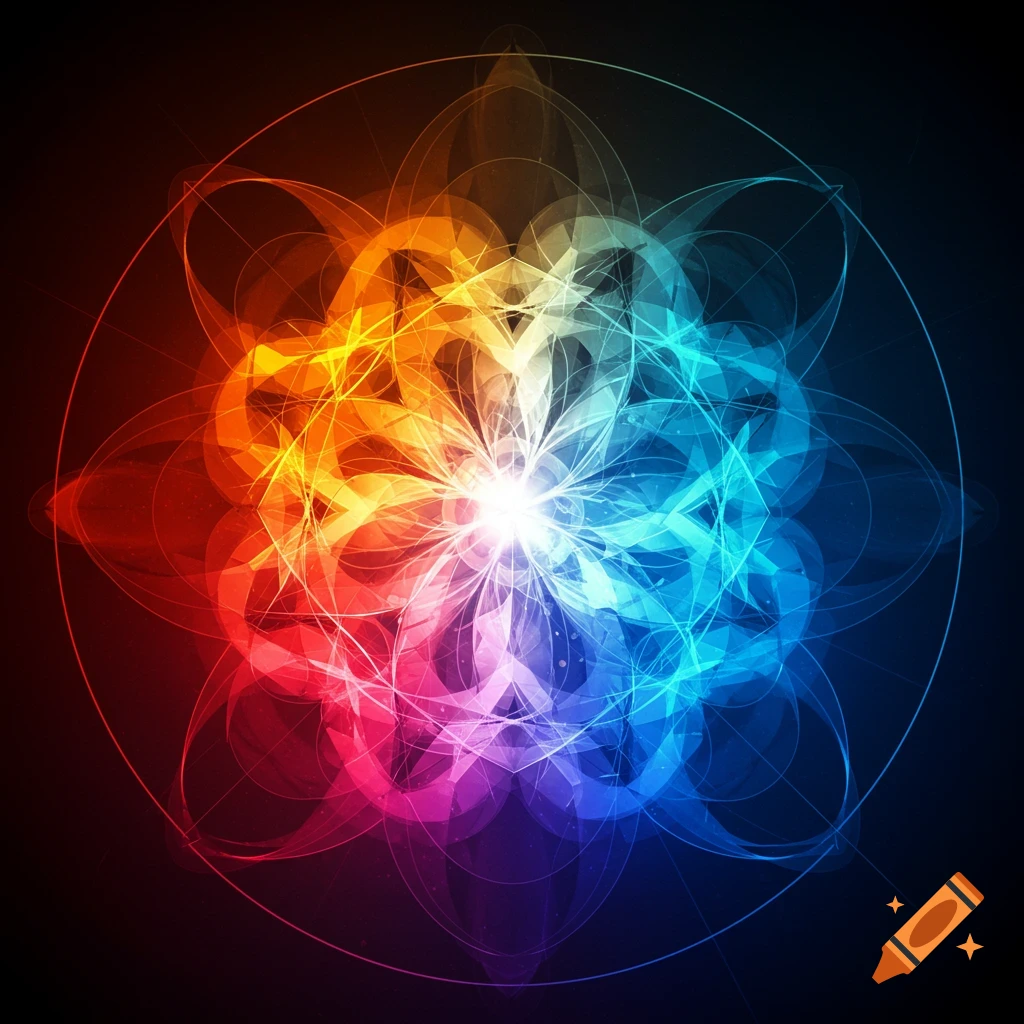
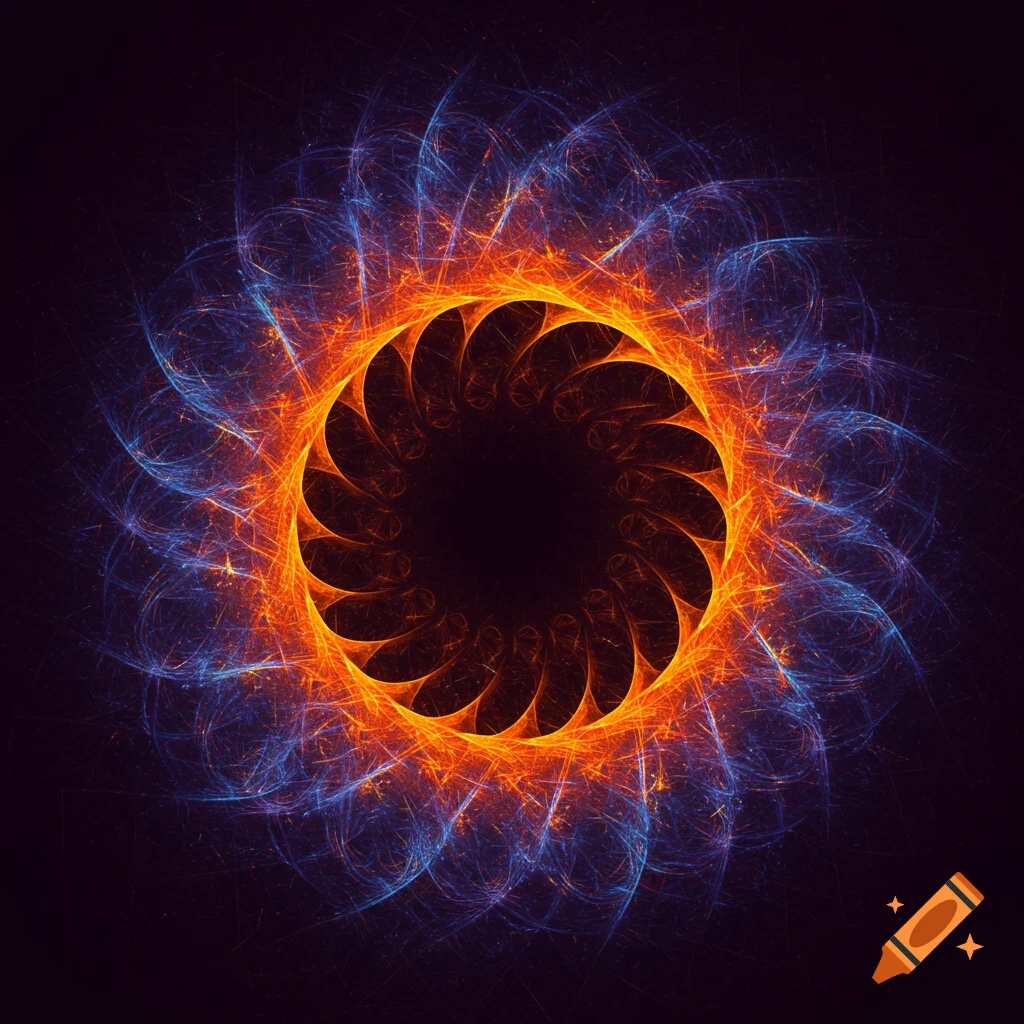
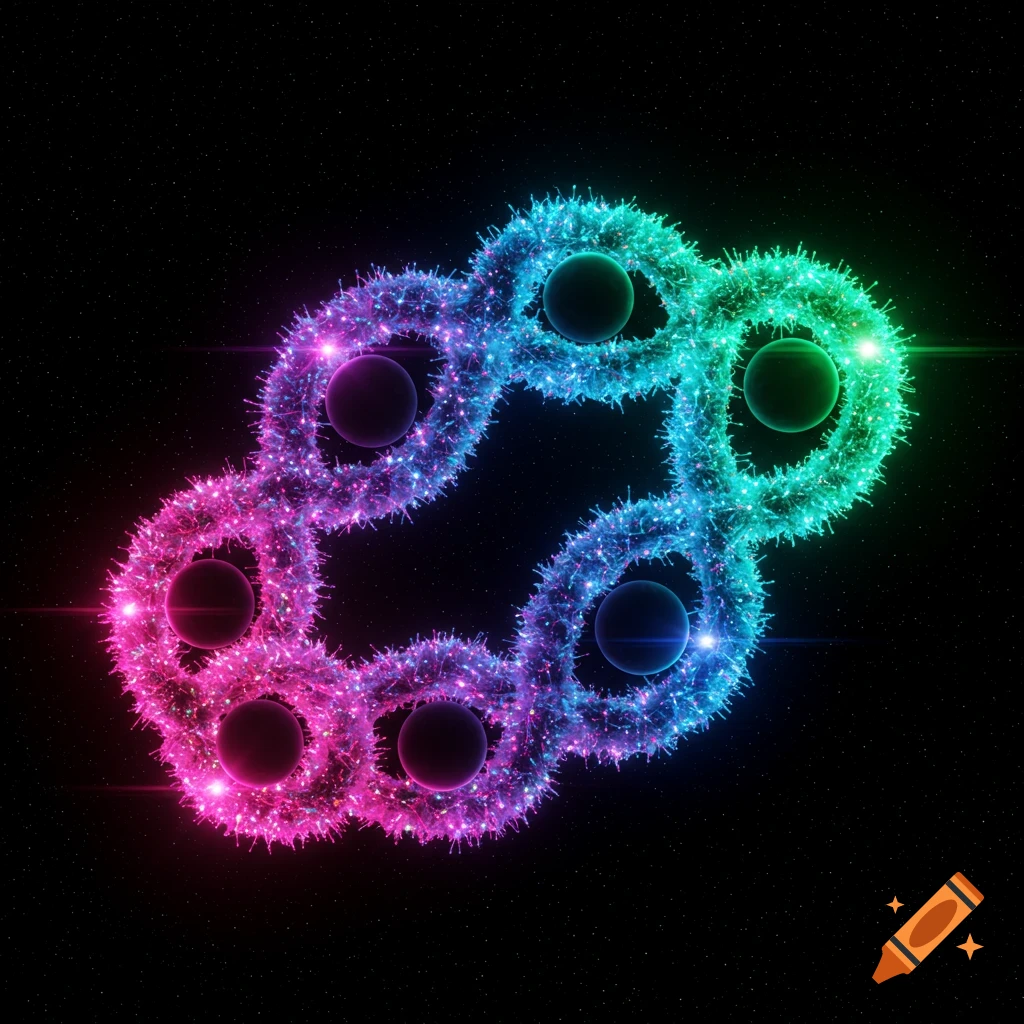
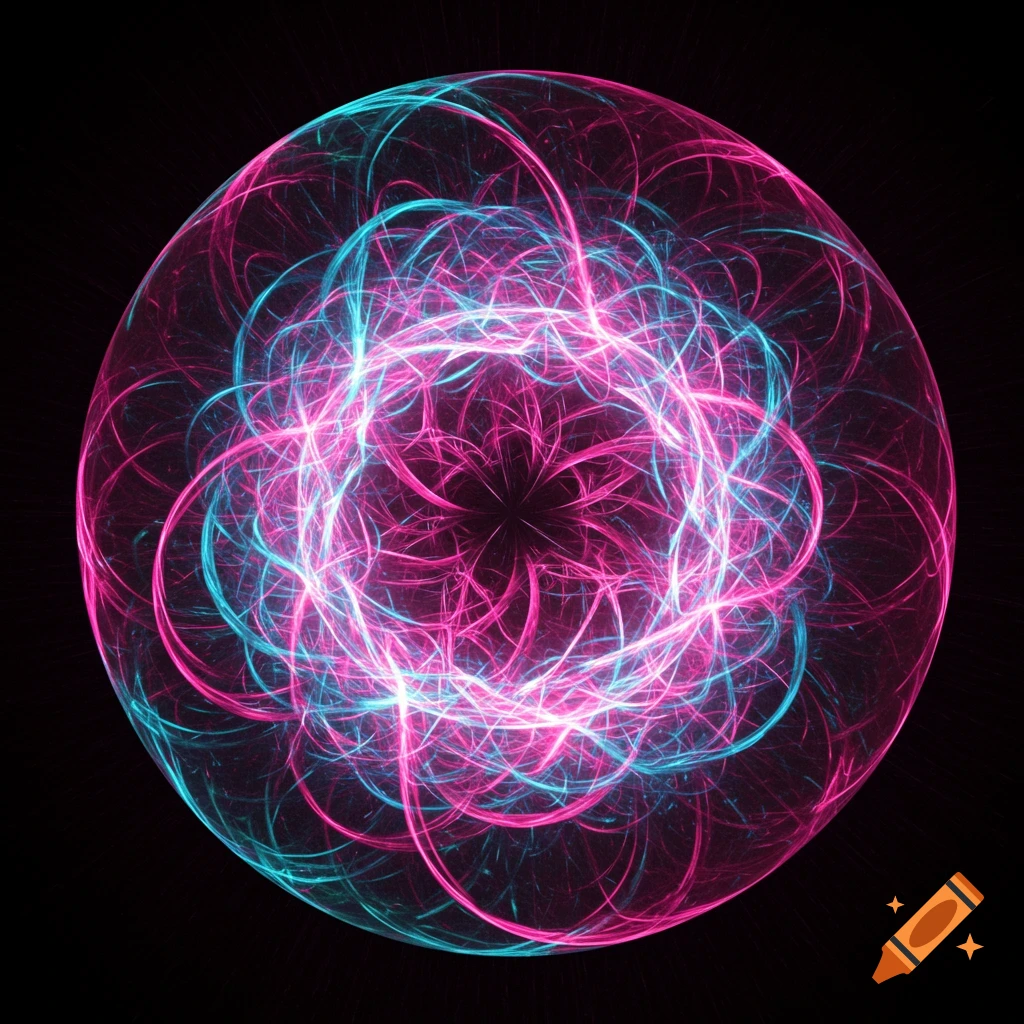
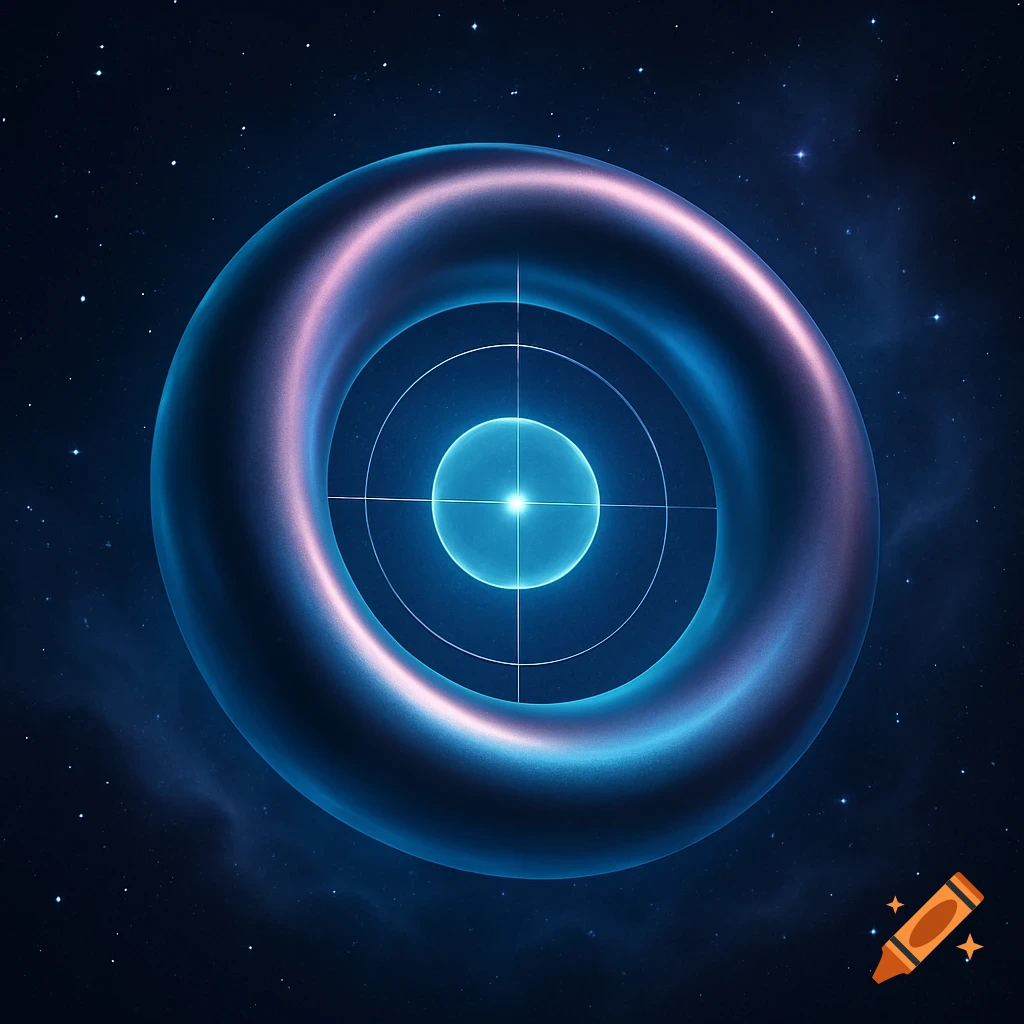
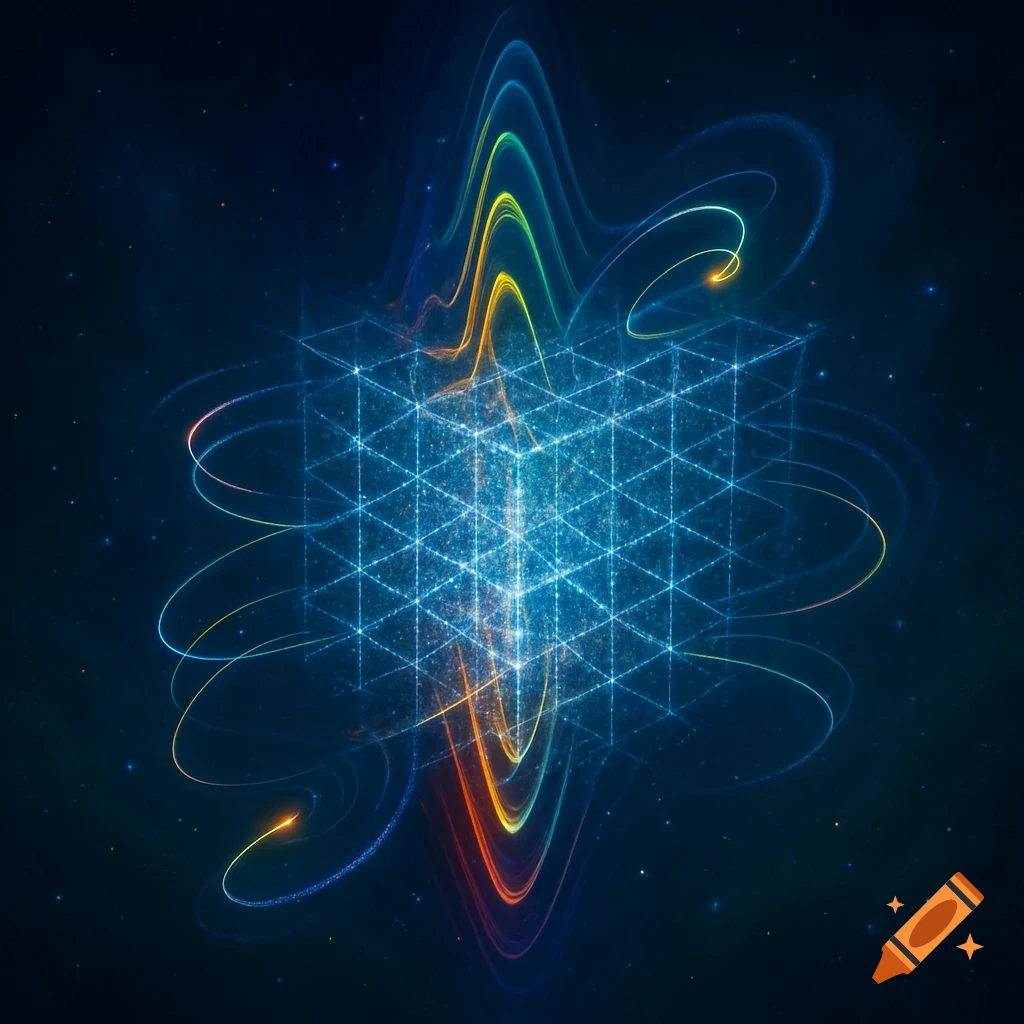
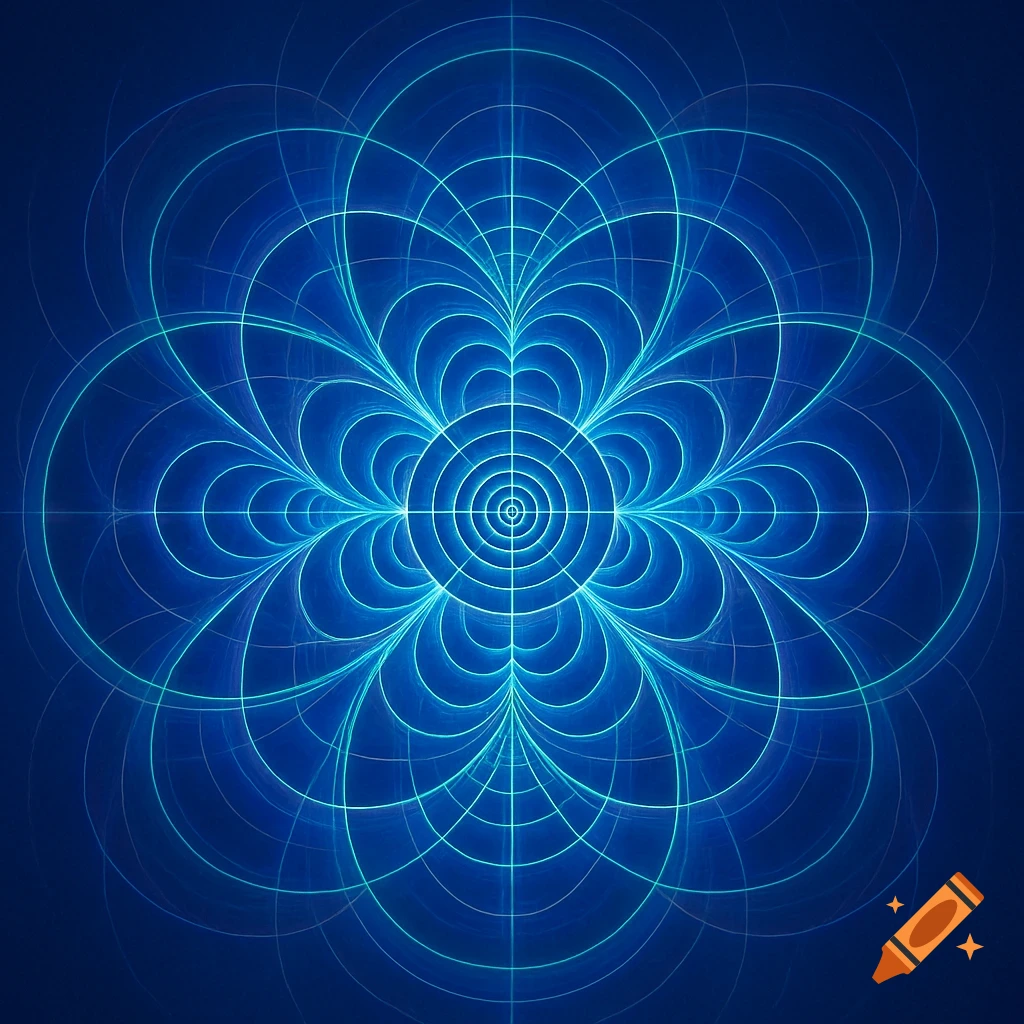
Abstract visualization of concentric, colorful, sparkling rings, white at the center fading to blue, green, yellow, and red outwards on a black background.
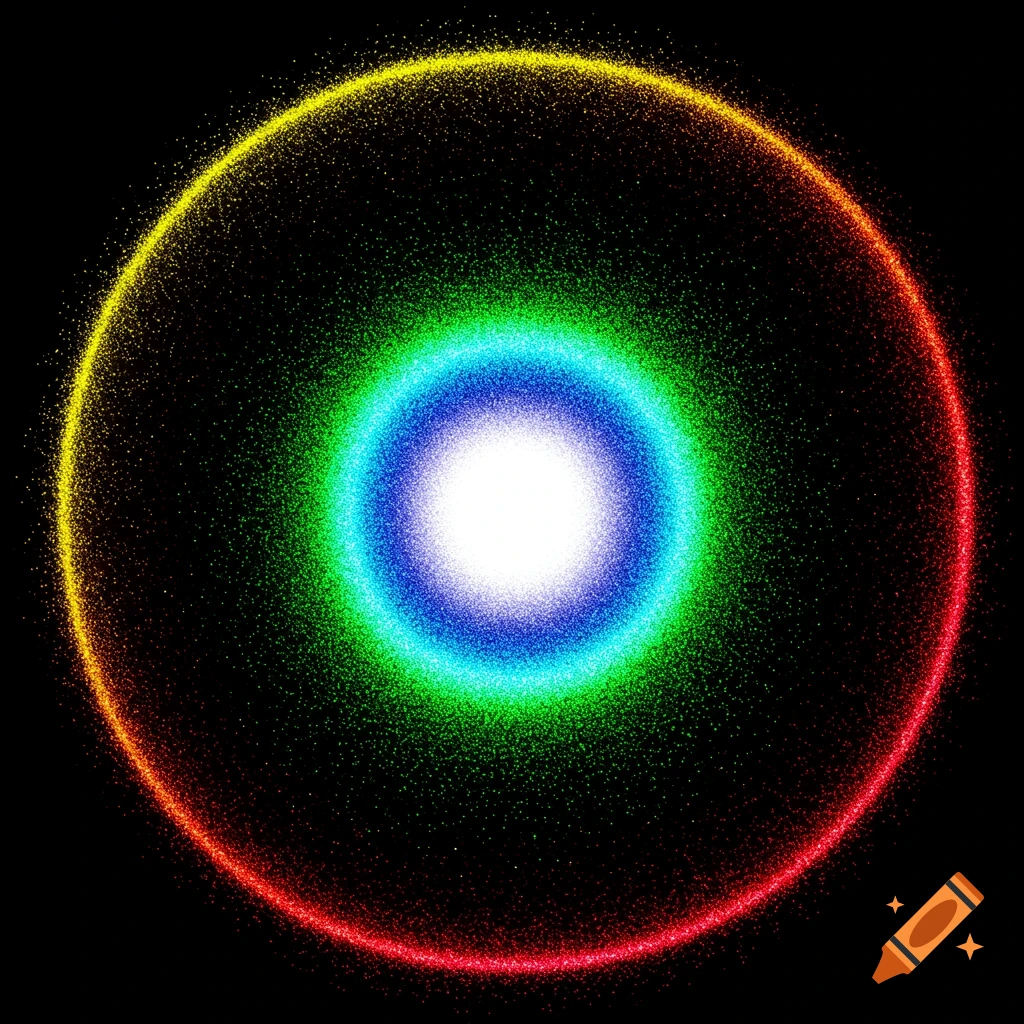
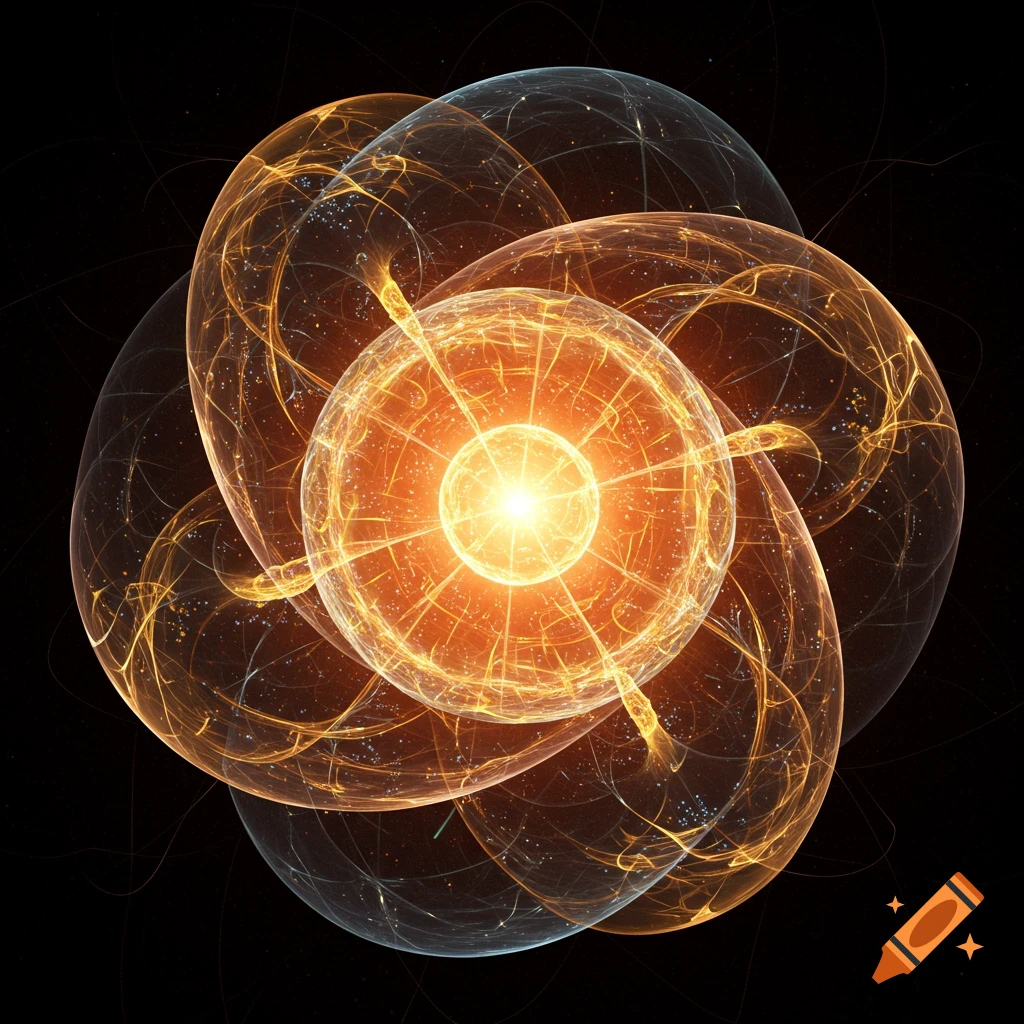
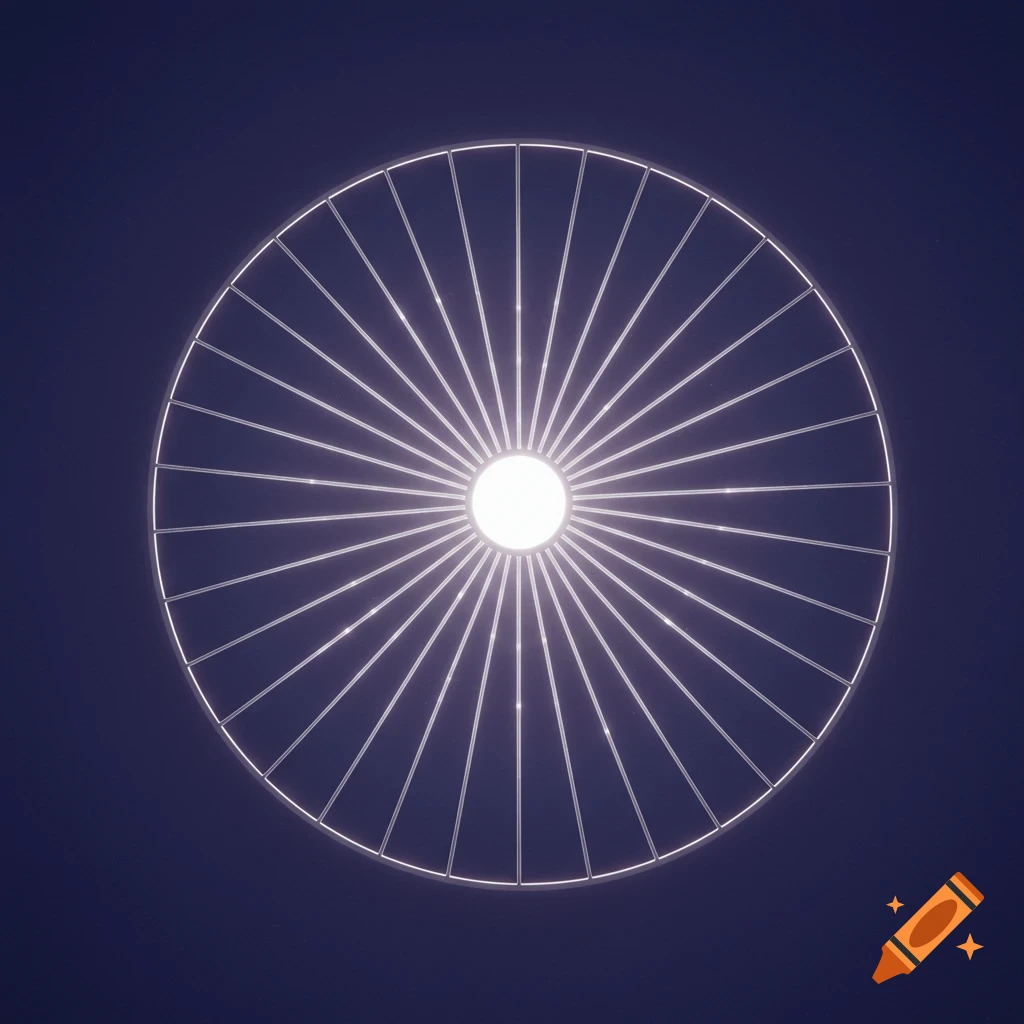
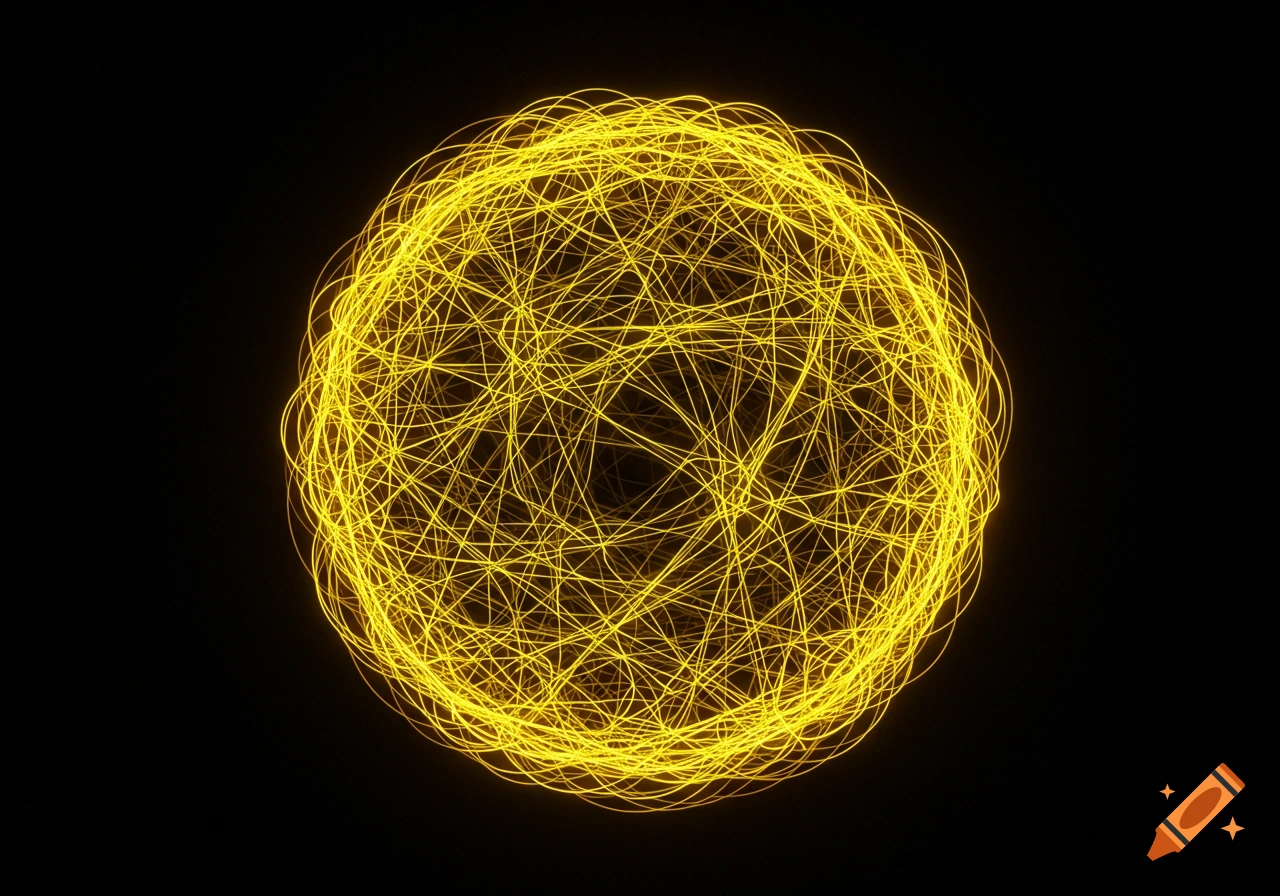
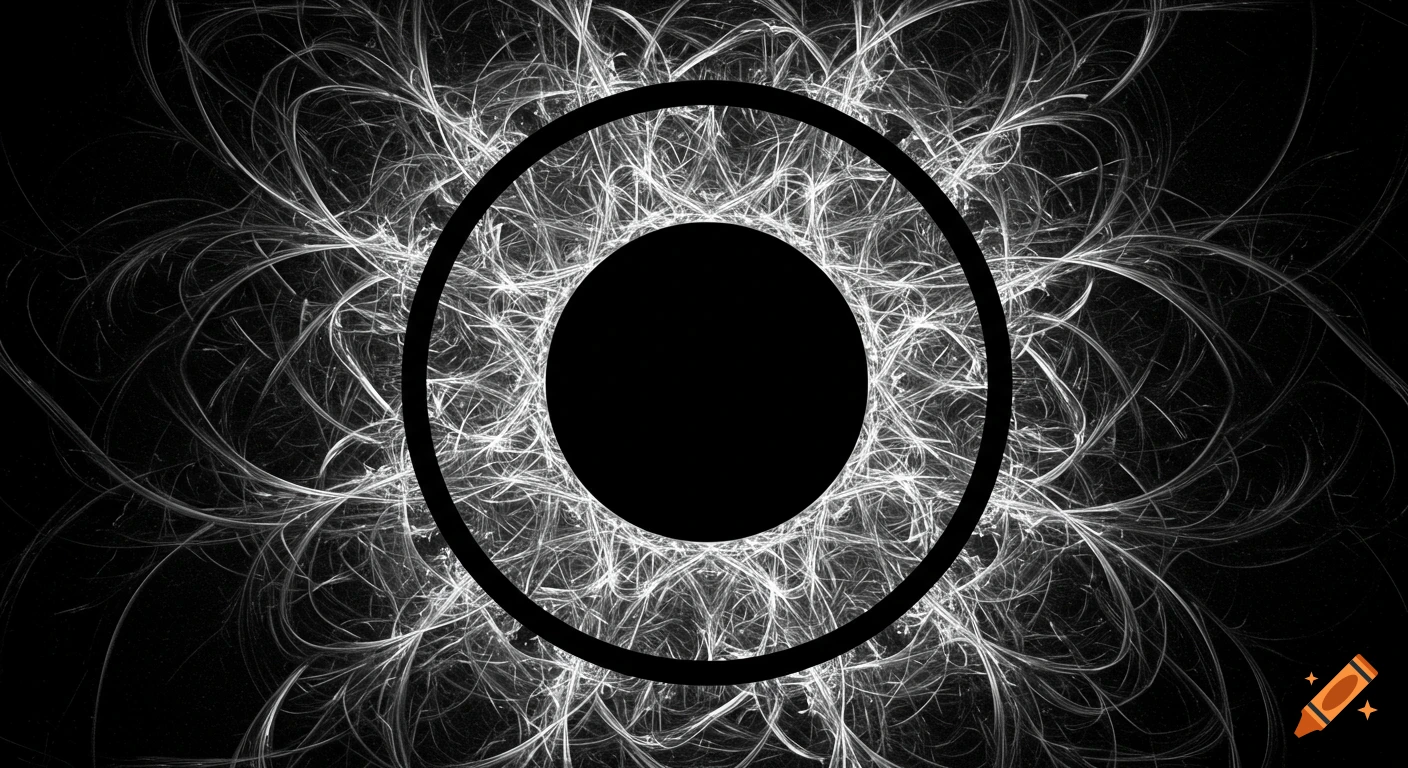
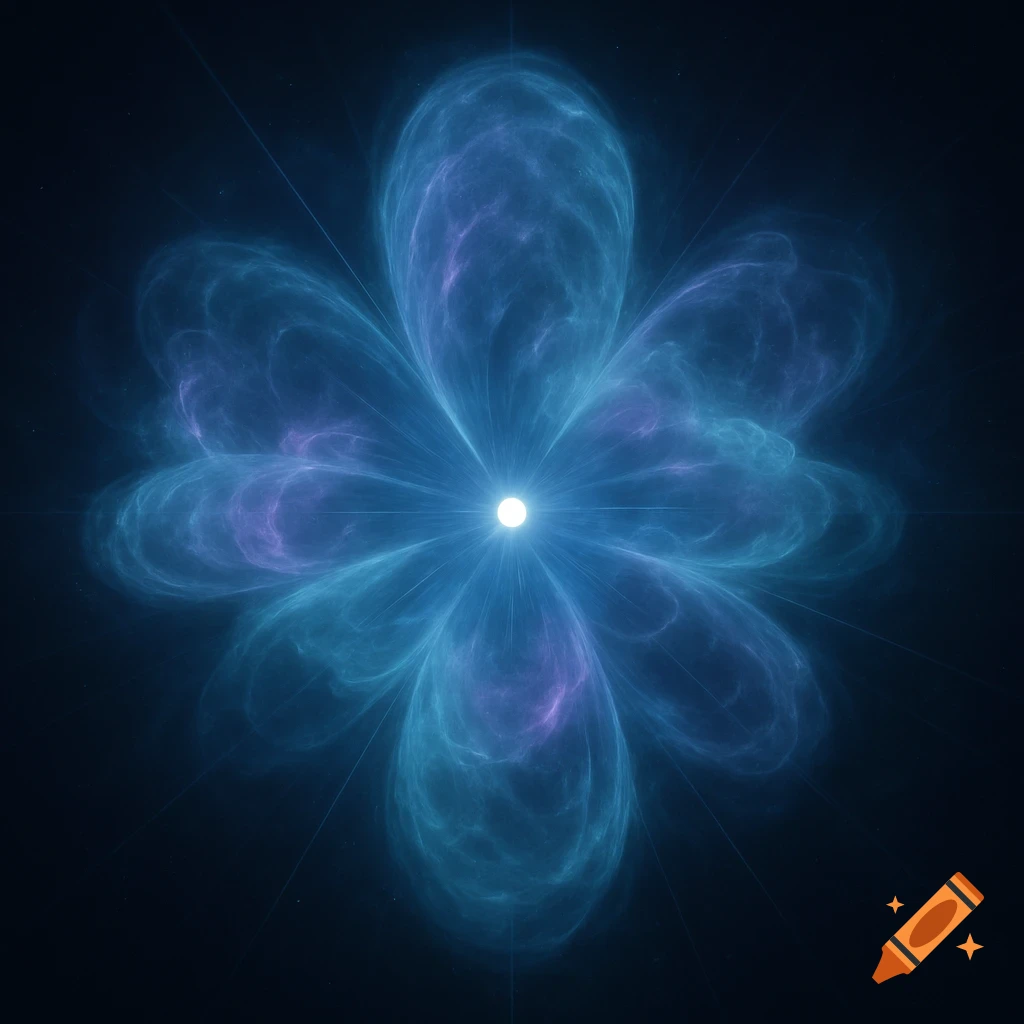
Visualize the radial density of a proton wavefunction “halo” in 3D spherical coordinates, suitable for high-quality reproduction on Eastman 5384 print stock. Use this proton wavefunction and density formula: \[ \psi(r) = \psi_0 \exp(-r/a) \] \[ \text{Density: } D(r) = |\psi(r)|^2 = |\psi_0|^2 \exp(-2r/a) \] Where: - \(\psi_0\) is a normalization constant, - \(a\) is the decay length parameter for the halo, - \(r = \sqrt{x^2 + y^2 + z^2}\) Produce a 3D isosurface or volumetric plot of \(D(x, y, z)\). Ensure spherical symmetry for computational efficiency if needed. **Color Mapping:** Map the normalized density to the HP 9845C UI color palette on a black background: - White: maximum density (center) - Yellow: high density - Cyan: mid-high - Green: medium - Blue: mid-low - Magenta: low - Red: very low - Black: minimum density/background Colors should be applied in order of decreasing density from center outward. Normalize density so the center is white and the outermost halo is black (or red for near-zero). **Printing Instruction:** Prepare the chart for output to Eastman 5384 print stock. Use true, saturated colors and ensure strong contrast on a black background, as per HP 9845C display standards. **Math and Plotting Example (PGFPlots Style):** \addplot3[ surf, domain=-3:3, y domain=-3:3, samples=40, colormap={HP9845C}{rgb=(1,1,1) rgb=(1,1,0) rgb=(0,1,1) rgb=(0,1,0) rgb=(0,0,1) rgb=(1,0,1) rgb=(1,0,0) rgb=(0,0,0)}, shader=interp ] {exp(-2*sqrt(x^2+y^2+z^2)/a)}; Set the plot’s See more