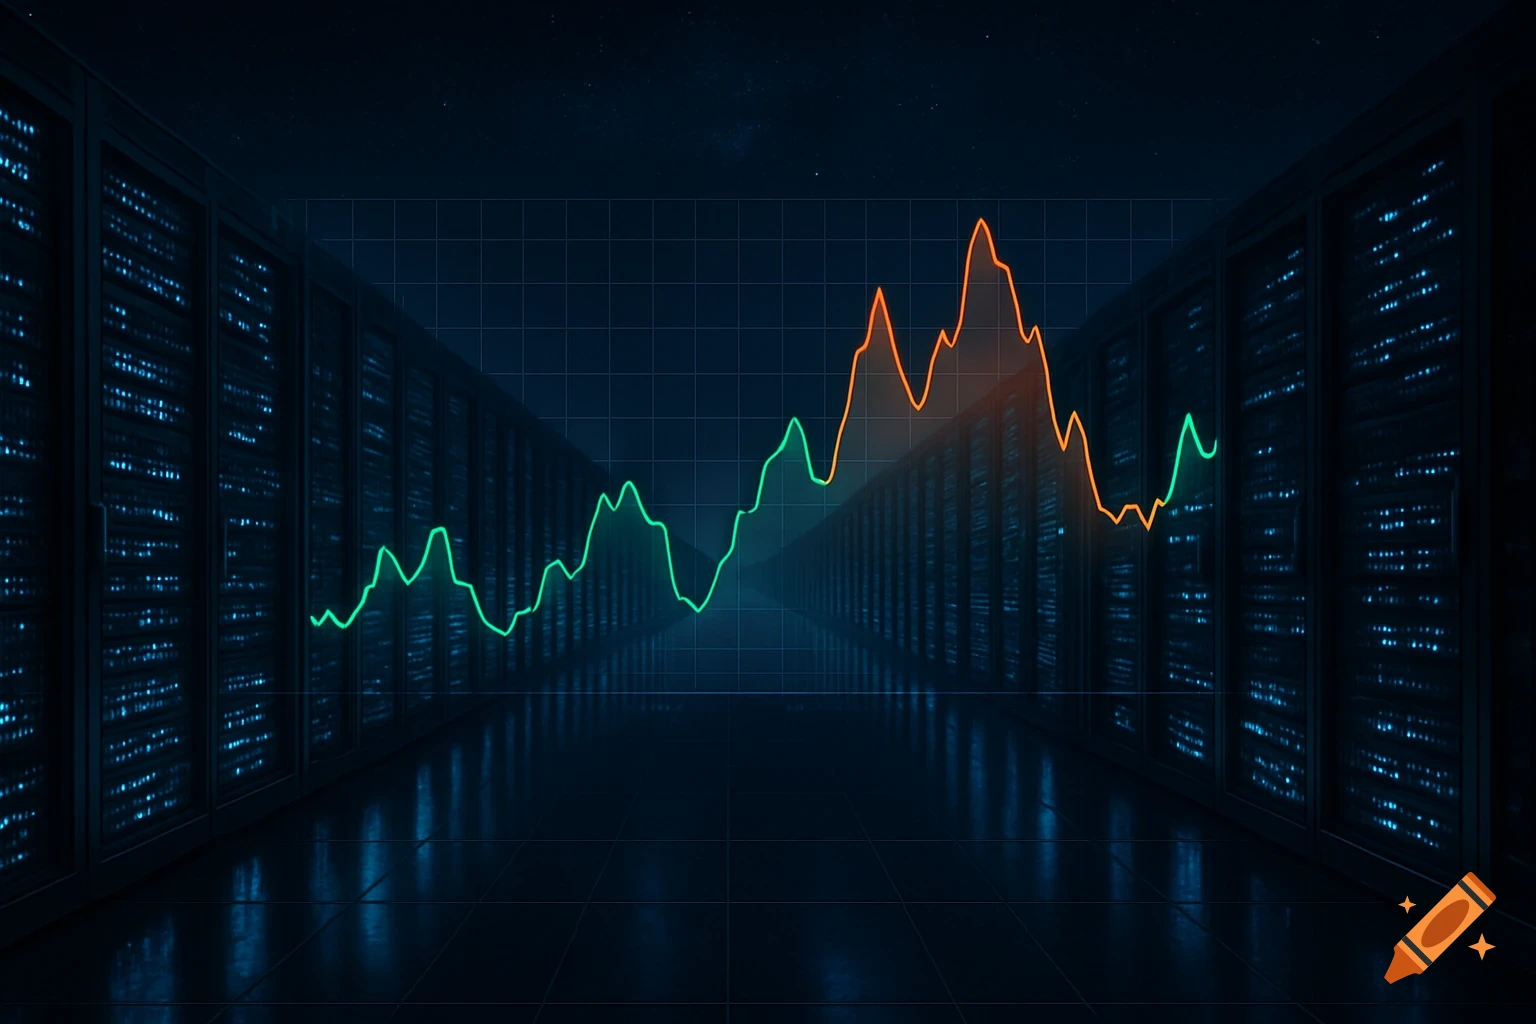
A vibrant 3D digital data graph with a red and orange peak showing temperature, set on a glowing blue grid with a circuit board background and floating particles.
A data table that shows the effects of changing the temperature or concentration of the reacting particles on the rate at which a reaction occurs. See more