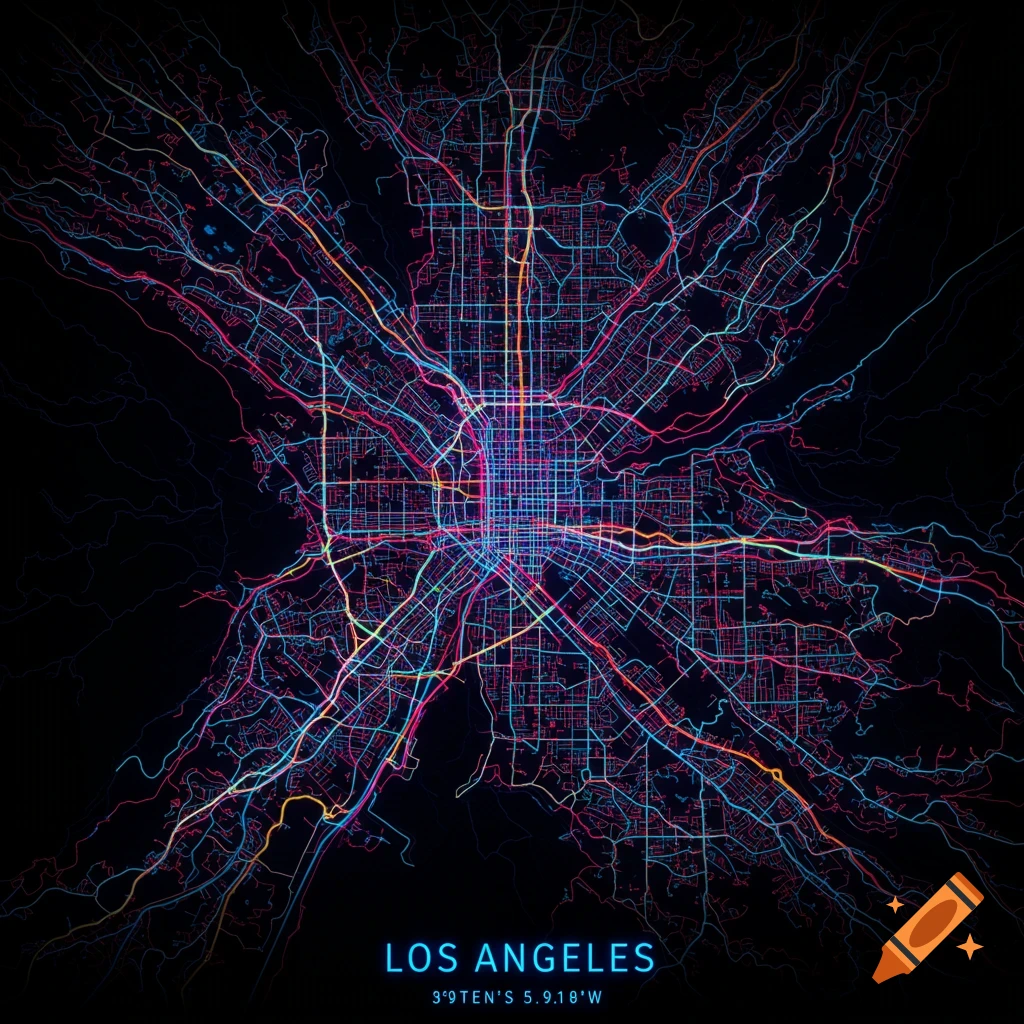
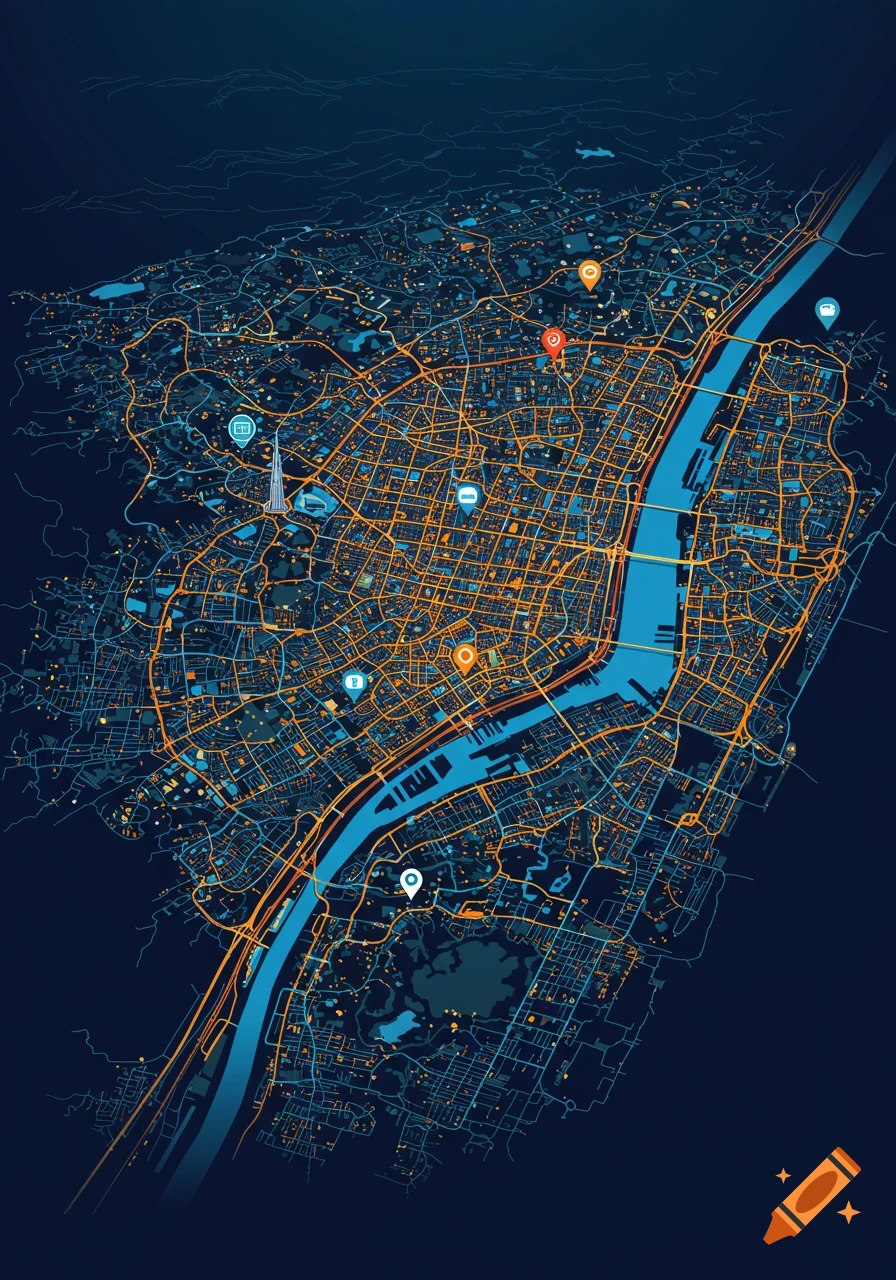
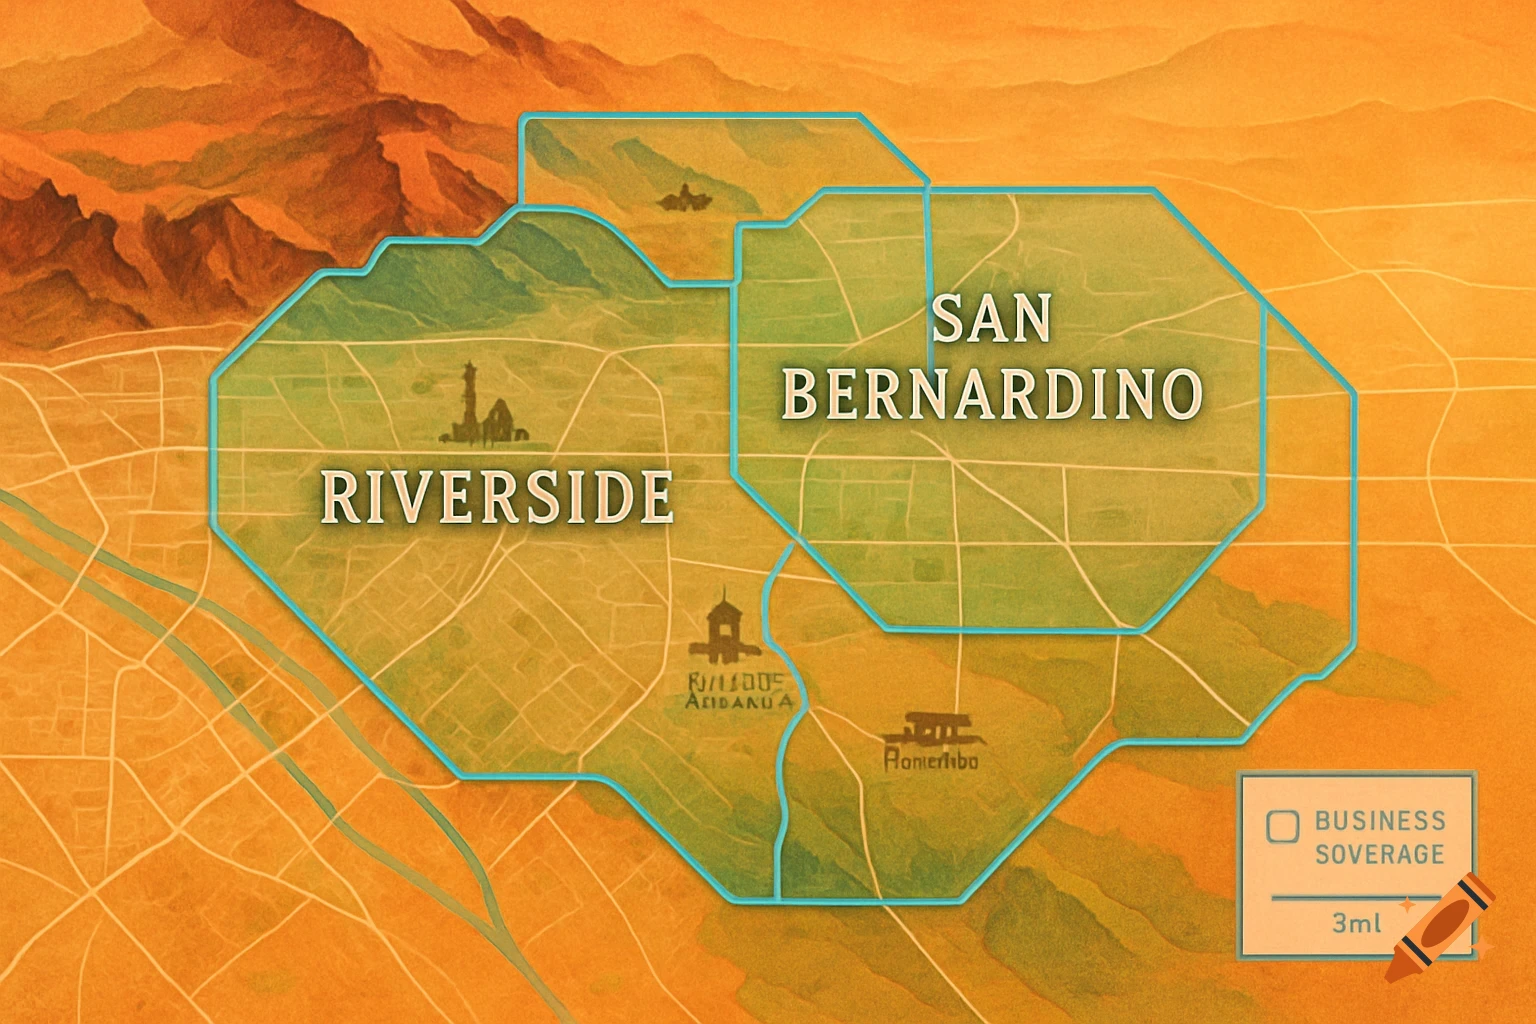
A data visualization showing two stylized maps of Los Angeles, one red-orange and one blue-green, with two line graphs below.
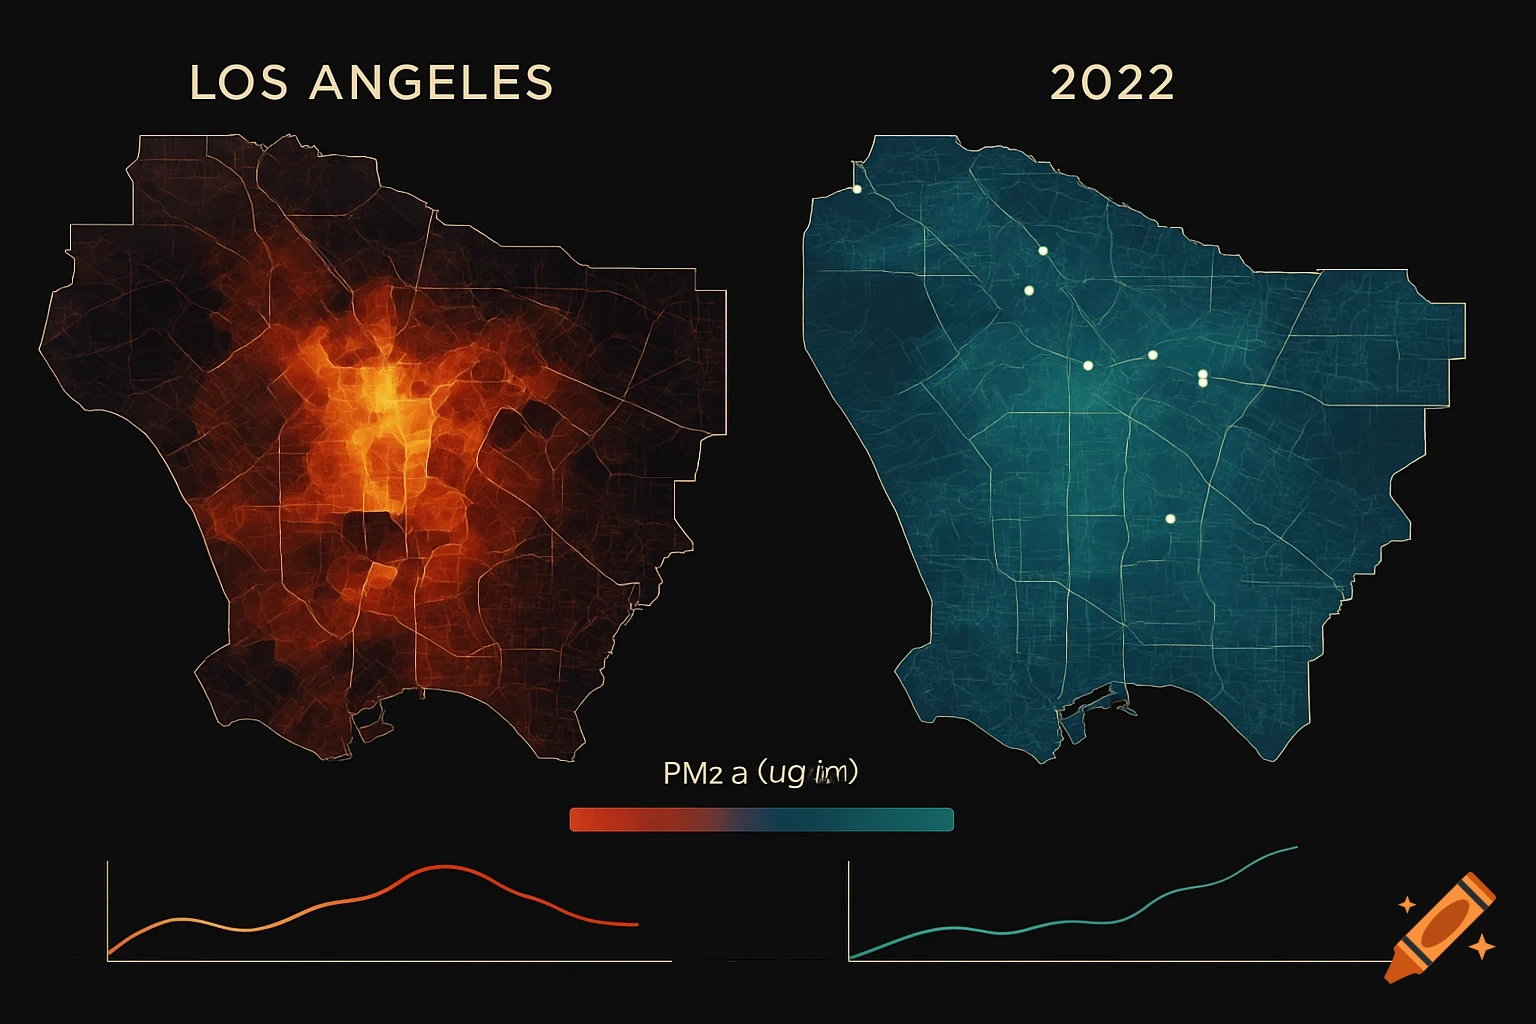
these are my instructions "As we discussed yesterday, you can use the attached files (map and socio-economic variables) to make the visualization. Also there are time series data for socio-economic variables, you should made the visualizaiton of individual variable by years. It is easy to use to python and geopanads to finish it. e.g. for year in (2016,2022):" can you find data online and create and image that follows these requirements? make it look like it was made from geopandas. I do not want code, just and image. the data I want the image based off of is PM2.5 levels in LA one map for 2016 and one map for 2022 See more